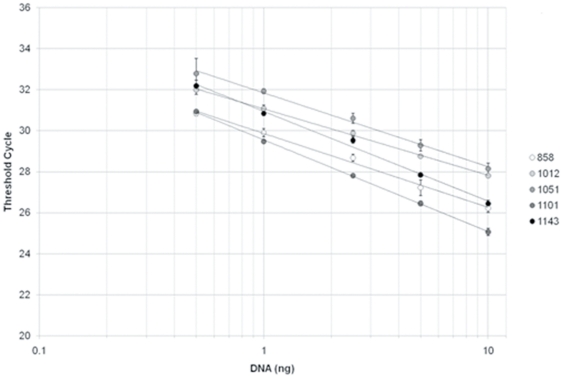
Figure 2. Threshold cycle against DNA quantity in the PCR mix for five soil DNA extracts with serial dilution.
DNA quantities are represented in logarithmic scale and correspond to a serial dilution series (10 ng, 5 ng, 2.5 ng, 1 ng, and 0.5 ng). The linear regressions were highly significant (r2>0.99) for each soil type. The equations of the regression line were for each soil sample: 858: y = −3.61x+29.86; 1012: y = −3.24x+31.06; 1051: −3.60x+31.84; 1101: y = −4.47x+29.55; 1143: y = −4.37x+30.94.

