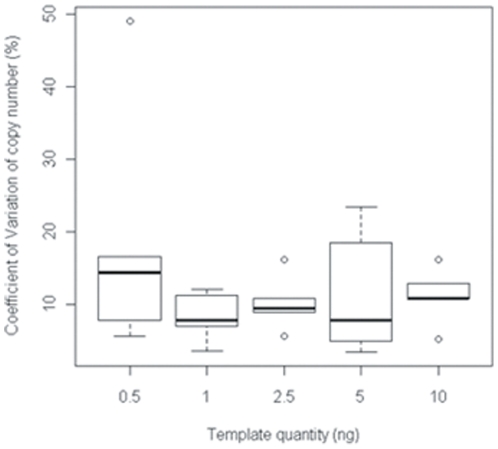
Figure 3. Variation coefficient of 18S rRNA gene copy number with DNA quantity in the PCR mix for five soil DNA extracts with serial dilution.
The box limits represent the first and third quartiles of the variation coefficient (CV), the bold line represents the median and the error bars represent the standard deviation. Empty circles correspond to the minimum and maximum of the CV. The CV for each soil was determined from 3 independent measurements.

