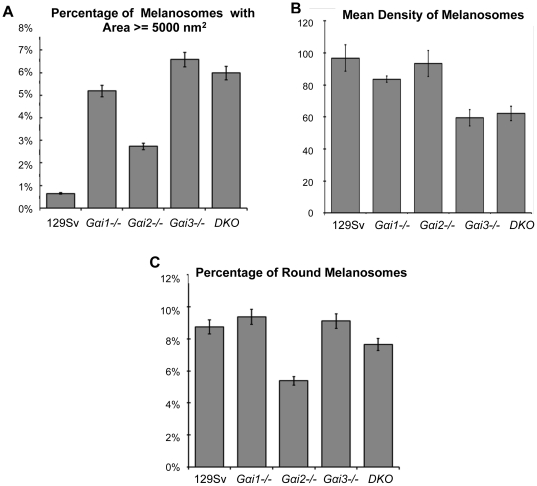
Figure 2. RPE melanosomal size, density and morphology of all Gαi-/- mice compared to control 129 Sv mice.
(A) Percentage of melanosomes larger than 5000 nm2 in each of the mouse lines analyzed. The Gαi3-/- mice have the highest percentage of melanosomes larger than 5000 nm2 in the RPE. (B) Mean density of melanosomes: The Gαi3-/- group had the lowest mean number of melanosomes per RPE area (59±5.2), and the wild-type and Gαi2-/- groups had the largest mean density of melanosomes (96.8±8.2 and 93.4±8.1, respectively). (C) Percentage of round melanosomes: The Gαi1-/- and Gαi3-/- groups have the larger number of round melanosomes (9.37±0.77 and 9.12±1.85 respectively), followed by the 129 Sv wild-type (8.75%±0.25), DKO (7.65%±0.31) and Gαi2-/- (5.39%±0.37).

