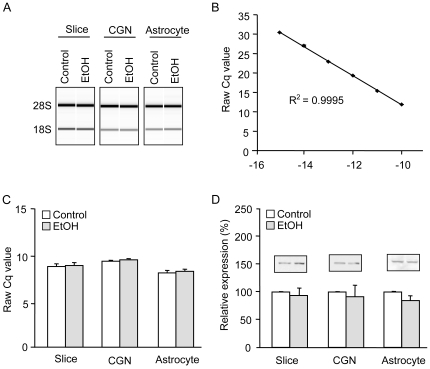
Figure 1. RNA quality, assay reliability, and validation of endogenous controls.
Total RNA quality was assessed using an Agilent Bioanalyzer 2100 and endogenous controls were validated for RT-qPCR and Western blot. A) Generated gel images show representative slice, CGN, and astrocyte samples with and without 24-hr ethanol treatment. B) A standard curve was performed using a dilution series of purified L1 template. Increases in template concentration result in decreasing Cq values, as expected for a well-functioning qPCR assay (n = 4). C) 18S Cq values are shown for all tissue/cell types with and without ethanol treatment. D) Representative Western blots for β-tubulin are shown for each sample type with and without 24-hr ethanol treatment. All bars (C, D) show the mean + SEM of 4 independent experiments.

