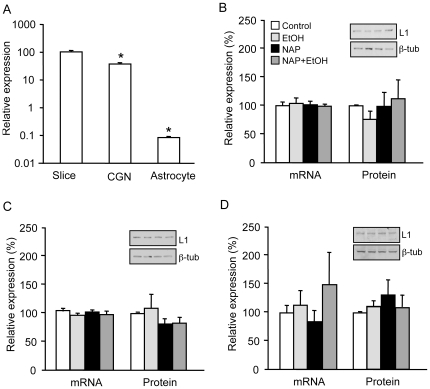
Figure 2. L1 expression in cerebellar slices, CGNs, and astrocytes.
A) Comparison of L1 transcript levels in different culture preparations. * p<0.0001 compared to slices. B–D) Total RNA and cell lysates were collected from slice, CGN, and astrocyte cultures after 24-hr exposure to 20 mM ethanol, 10−12 M NAP, or the combination of NAP and ethanol. L1 mRNA expression was measured by qRT-PCR and normalized to 18S. L1 protein levels were measured by Western blot and normalized to β-tubulin (representative images shown above corresponding bars). L1 mRNA and protein levels are shown in cerebellar slices (B), CGNs (C), and astrocytes (D). Legend in B applies to B–D. All bars represent normalized mean + SEM of 4 independent experiments.

