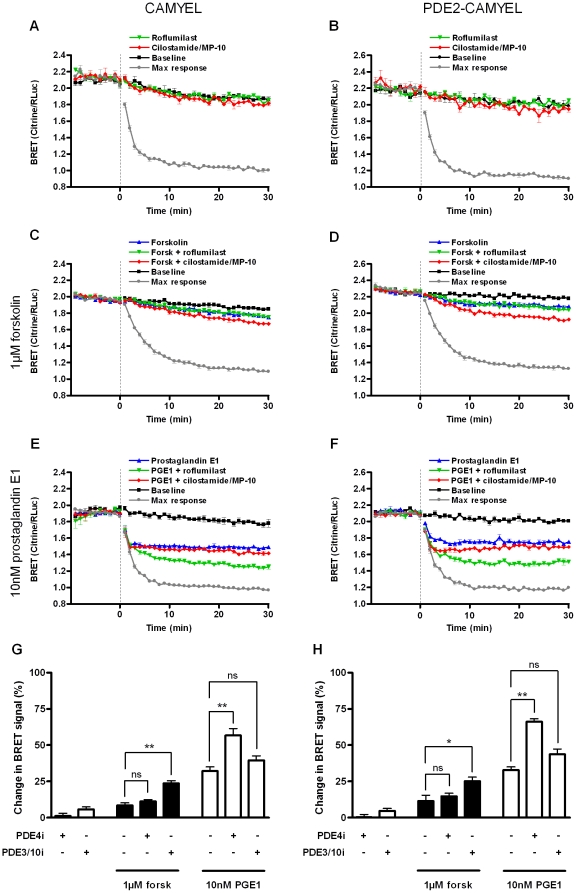
Figure 4. Effect of selective PDE inhibitors on cAMP response in HEK293 cells.
Changes in BRET signal were measured in HEK293 cells transfected with either CAMYEL or PDE2-CAMYEL. (A and B) BRET was measured in response to addition of PDE inhibitors. 50 nM roflumilast or 400 nM cilostamide and 300 nM MP-10 was added at time 0. (C–F) BRET was measured in response to stimulation with 1 µM forskolin (C, D) or 10 nM PGE1 (E, F). Forskolin or PGE1 was added at time 0 alone or in combination with 50 nM roflumilast or 400 nM cilostamide and 300 nM MP-10. For baselines, buffer was added, and for maximum response, 10 µM forskolin plus all three PDE inhibitors were added. Each point represents the mean ± SEM of triplicate determinations in a representative experiment. (G and H) Summary of BRET measurements. Relative BRET responses are averaged for the time period 21–30 min after addition of drugs. The results represent the mean ± SEM of three experiments. ns (not significant), P>0.05; *, 0.01<P<0.05; **, 0.001<P<0.01.

