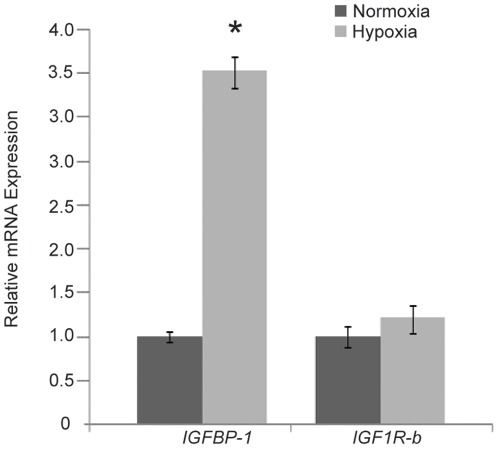
Figure 4. Hypoxia induces IGFBP-1 mRNA expression in zebrafish embryos at prim-5 stage.
Expression levels of IGFBP-1 mRNA and IGF1R-b mRNA were quantified using real-time PCR and normalized against 18S rRNA. Data are the mean relative fold changes ± SE (n = 10) with respect to the control (normoxia) level (arbitrarily set to 1). Significantly higher IGFBP-1 mRNA expression was found in hypoxic embryos as compared with normoxic embryos. No significant difference in IGF1R-b mRNA expression was found between normoxic and hypoxic embryos. * denotes p<0.05.

