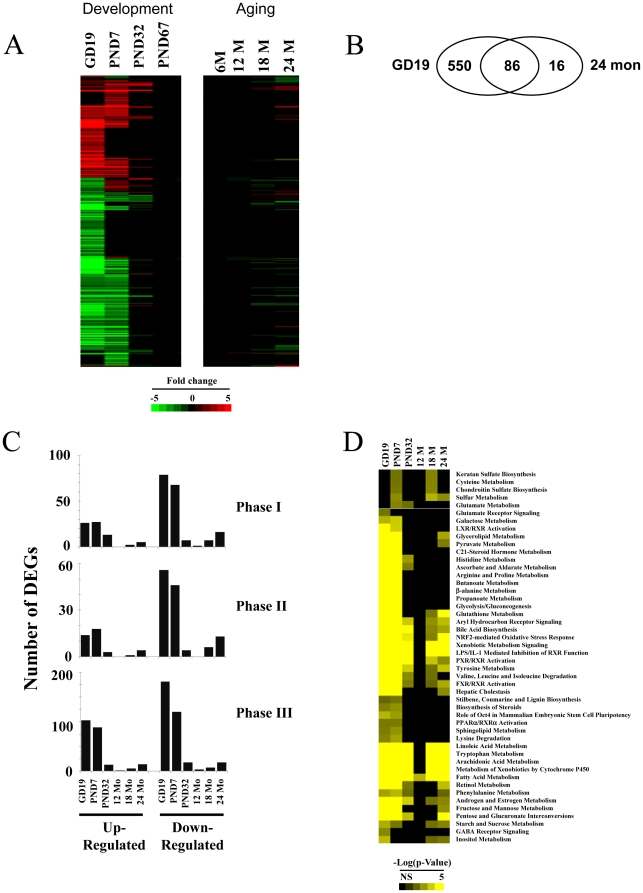
Figure 2. Altered expression of XMETs in the male mouse liver at different life stages.
A. XMET expression at different life stages. XMET genes which exhibited significant differences in expression compared to adult animals were identified as detailed in the Materials and Methods. Genes were clustered using one-dimensional hierarchical clustering. B. Overlap in the XMET probe sets altered in the fetus (GD19) and at 24 months. C. Quantitation of the number of up- and down-regulated phase I, II and III probe sets at different life stages. DEGs, differentially expressed genes. D. Canonical pathways overrepresented by the XMET probe sets at different life stages. XMET genes described in Figure 2A were analyzed by Ingenuity Pathways Analysis. Pathways were clustered by one-dimensional clustering. Scales at the bottom indicate the −log(p-value) for all genes.

