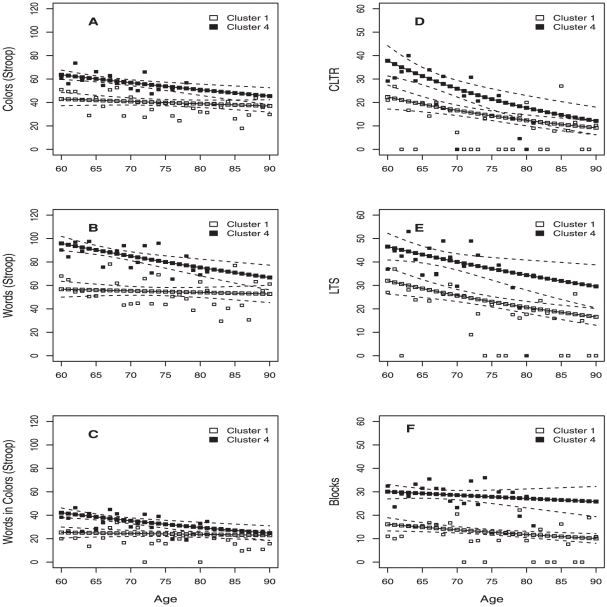
Figure 3. Fitted and observed values on cognitive decline for clusters 1 and 4.
Fitted and observed values on cognitive decline, for each neurocognitive test, after adjusting a quasipoisson regression as a function of age and level of education. The 95% confidence interval was estimated for each of the fitted lines. Clusters were identified by the multivariate regression tree analysis.

