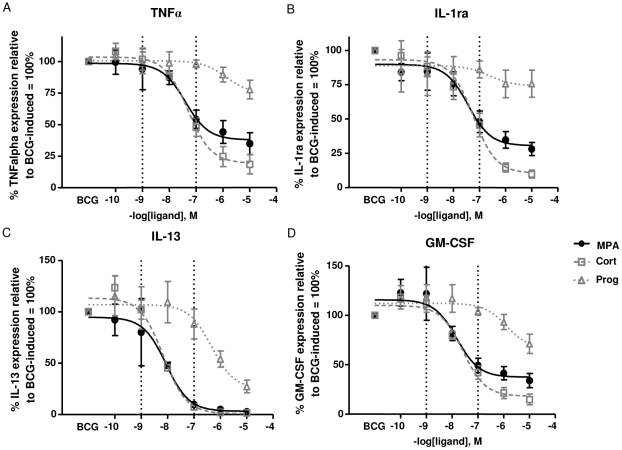
Figure 3. Dose-response curves of cortisol, MPA and progesterone on BCG-induced cytokine expression.
Culture supernatants of PBMCs stimulated with a concentration of 5×10⁵ CFU/ml BCG in the absence and presence of the three hormones were collected six days post stimulation (n = 4). TNFα, IL-1ra, IL-13 and GM-CSF (A-D) levels were measured using a Multiplex bead array assay. Hormone stimulated responses are depicted as percentages of the BCG only (100%) responses. Dotted lines indicate the range of MPA serum concentrations measured in contraceptive users. Dose-response curves were generated using GraphPad Prism 5 (nonlinear regression curve) and data are presented as mean ± SEM. Data of four study participants were analyzed to obtain IC50 and EC50 values.

