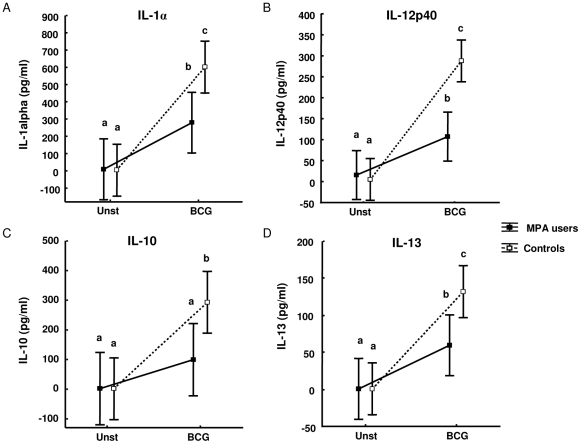
Figure 5. Differential expression of IL-1α, IL-12p40, IL-10 and IL-13 in supernatants of BCG stimulated PBMCs of MPA users and control participants.
PBMCs of MPA users (n = 8) and controls (n = 11) were cultured as unstimulated controls and with M.bovis BCG. Culture supernatants were collected after three days and cytokine responses were measured by Multiplex bead array assay. Data were analyzed by mixed model repeated measures ANOVA with a Fisher LSD Post-Hoc test and are represented as LS means and 95%CI. The letter a, b and c indicate statistical significance. Values with the same letters are not statistically significantly different from each other.

