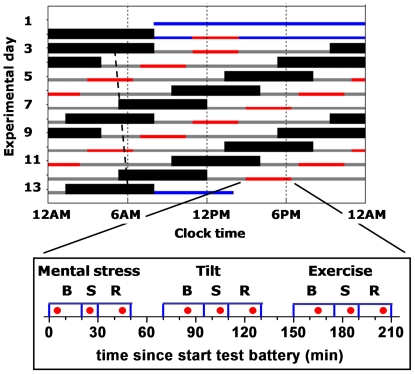
Figure 1. Protocol.
Rasterplot, including two baseline days, twelve 20-h cycles, and discharge day of an example subject with a habitual bedtime of midnight. Blue bars, baseline and discharge wake episodes in normal room light (∼90 lux); solid back bars, scheduled sleep (0 lux); gray bars, wake episodes in dim light (∼1.8 lux); red bars, timing of the test batteries; dotted line illustrates the circadian core body temperature minimum throughout the protocol, with an average circadian period of 24.09h in these subjects. Each test battery consisted of a mental, tilt, and exercise stress (S) test, each preceded and followed by a baseline (B) and recovery (R) episode. The timing of the blood draws is indicated as red filled circles.

