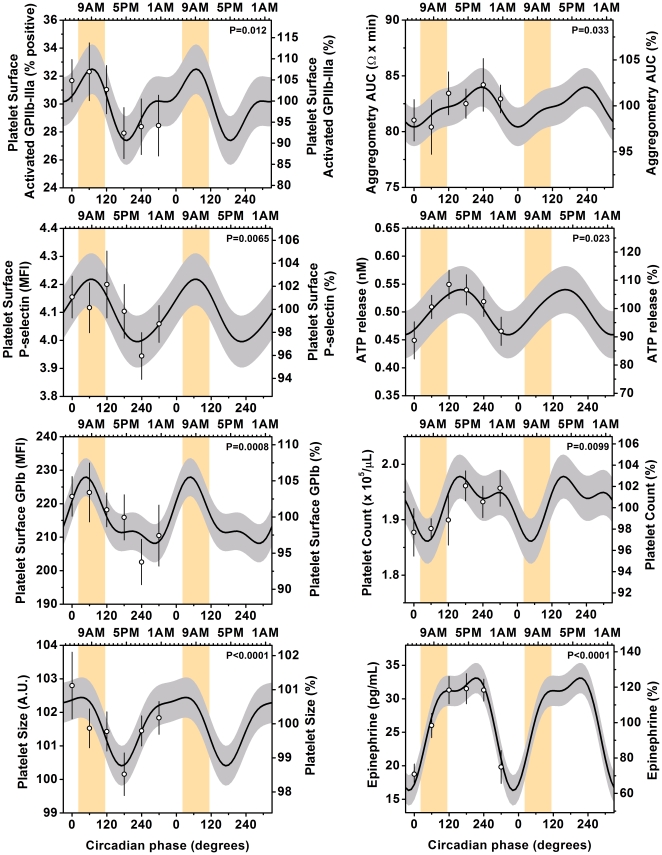
Figure 2. Independent influence of circadian cycle on platelet function.
Cosinor models of circadian rhythms in platelet function. Cosinor and other statistical analysis were performed on the 360° data sets, whereas data are double plotted (2 identical circadian cycles) to aid visualization of rhythmicity (the second circadian cycle data were not used for analyses). Each of the platelet surface markers of platelet activation (activated GPIIb-IIIa, P-selectin, and GPIb) and platelet size had significant endogenous circadian rhythms with circadian peaks corresponding to the vulnerable time of 6AM-noon (indicated by the orange bars). Platelet count, ATP release, WBA and plasma epinephrine also had significant circadian rhythms but with peaks later in the circadian cycle (3–8PM). The cosine models (black lines) and 95% confidence intervals (gray areas) are based on mixed model analyses and use precise circadian phase data. To show that these models adequately fit the actual data, we also plot average data grouped into 60 circadian degree windows with SEM error bars (averaged data are not double plotted). Bottom x-axes, circadian phase with 0° indicating the timing of the core body temperature minimum (average ∼4:30AM in these subjects); top x-axes, corresponding average clock time in these subjects; left y-axes, absolute values; right y-axes, percentage of each individual's mean across the protocol; P values, significance of circadian effect from cosinor analyses.

