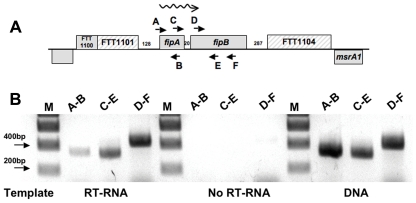
Figure 1. fipA and fipB are co-transcribed.
RNA was isolated from wild-type Schu S4, and then converted to cDNA. (A) Overview of chromosomal region containing fipA and fipB. Short arrows indicate the location of the PCR primers. The wavy arrow indicates the direction of transcription. The numbers between the genes indicate the size of the intergenic region. The hatched boxes (FTT1101 and FTT1104) indicate predicted pseudogenes. (B) PCR was performed using the indicated primers (RT-RNA). Controls were: No reverse transcriptase added to the cDNA synthesis reactions (No RT-RNA), and PCR using Schu S4 DNA as template and the indicated primers (DNA). Expected sizes of PCR products were as follows A–B: 314 bps, C–E: 311 bps, and D–F: 392 bps.

