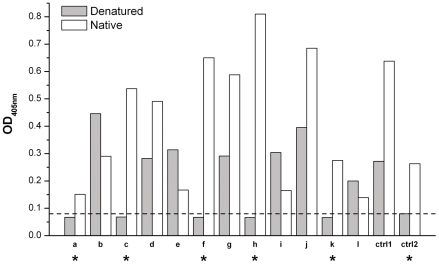
Figure 3. Representative ELISA results for the 12 initial candidates (a-l) for CLC-ec2 in the native or unfolded condition.
Ctrl1 and Ctrl2 represent controls for test-bled serum (1/1000 dilution) on CLC-ec2 and anti-CLC-ec1 antibody (1 µg/mL concentration) on CLC-ec1, respectively. The dashed line indicates the cut-off line for negative result in the unfolded condition. Clones showing a negative signal in unfolded condition and that had a signal at least twice higher than background in the native conditions were to be tested further (marked as *).

