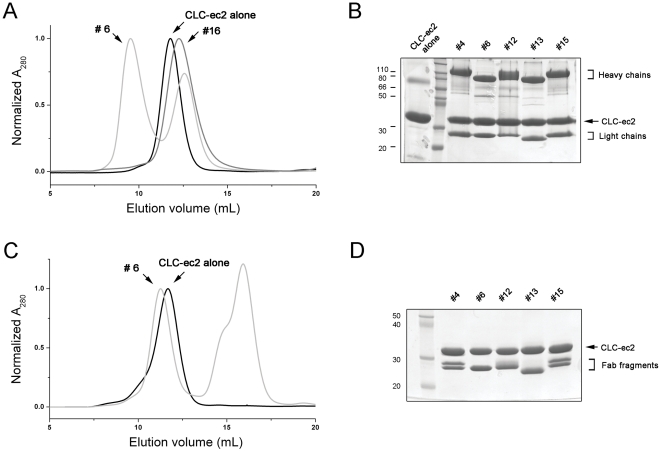
Figure 4. Evaluation of membrane protein-antibody complexes.
A. Size-exclusion chromatography profiles of protein-antibody complexes. CLC-ec2 alone eluted at ∼12 mL (black line). Chromatogram of clone #6 showed two peaks at ∼9 mL for antibody-CLC-ec2 complex and at ∼13 mL for free antibody (light gray line). However, clone #16 eluted at ∼12.5 mL as a single broad peak (gray line), which represents co-migration of unbound antibody and CLC-ec2. B. Early peak fractions around 9–11 mL from size-exclusion column were run on SDS-PAGE. C. Fab#6-CLC-ec2 complex (light gray line) is eluted ∼0.5 mL earlier than CLC-ec2 alone (black line) followed by free-Fab and Fc in 15–16 mL position. D. Fab-CLC-ec2 complex fractions were resolved by SDS-PAGE.

