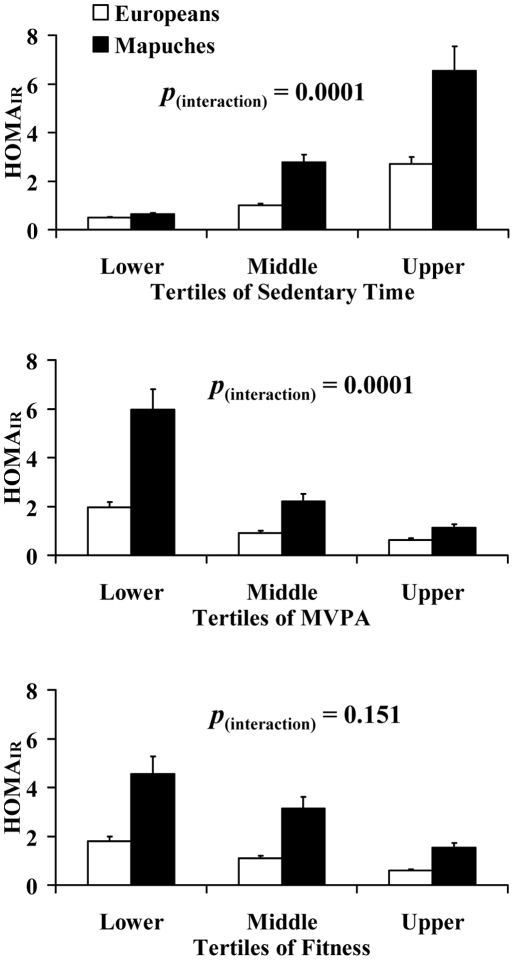
Figure 3. Effects of sedentary time, moderate-to-vigorous physical activity and fitness on HOMAIR in European and Mapuche participants.
Bars show mean ± SEM for all groups. p (interaction) describes the ‘tertile x environment’ interaction for HOMAIR after adjustment for potential confounding covariates (tertile cut-points shown in Table S2, see text or Table S4 for list of covariates).

