
Figure 6.
 Reactant Binding Diagram.
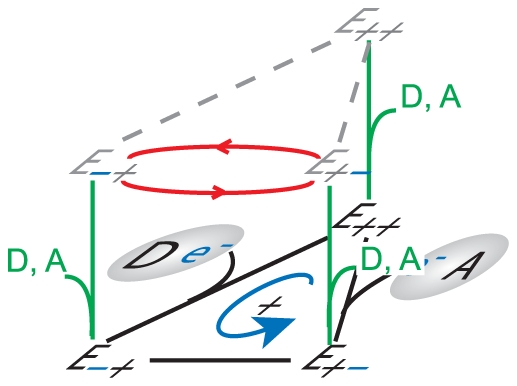
A simplified representation of how the binding of the EC reactants (green transition lines) separates the futile cycles (red transition lines) from the active redox cycles (original redox kinetic diagram).