

Abstract
Nutritively sweetened beverages (NSBs) may play a role in the obesity epidemic. We abstracted data from randomized controlled trials (RCTs) and evidence-based reviews through January 2009 concerning effects of consumption of NSBs on changes in body weight and adiposity. Studies included were those 1) conducted in humans; 2) lasting at least 3 weeks; 3) incorporating random assignment of subjects to conditions that differed only in the consumption of NSBs; and 4) including an adiposity indicator as an outcome. Twelve studies met the inclusion criteria. Meta-analysis of 6 studies that added NSBs to persons’ diets showed dose-dependent increases in weight. Contrarily, meta-analysis of studies that attempted to reduce NSB consumption consistently showed no effect on BMI when all subjects were considered. Meta-analysis of studies providing access to results separately for subjects overweight at baseline showed a significant effect of a roughly 0.35 standard deviations lesser BMI change (i.e., more weight loss or less weight gain) relative to controls. The current evidence does not demonstrate conclusively that NSB consumption has uniquely contributed to obesity or that reducing NSB consumption will reduce BMI levels in general. We recommend an adequately powered RCT among overweight persons, among whom there is suggestive evidence of an effect.
Keywords: Randomized clinical trials, soda, beverages, soft drinks, obesity, weight loss, bias
INTRODUCTION
Two propositions are widely expressed: (a) the consumption of nutritively sweetened beverages (NSBs) contributes significantly to the development and maintenance of overweight and obesity, and (b) reducing the consumption of NSBs will lead to weight loss or less weight gain (1). These propositions are plausible because epidemiologic studies support an association between NSB consumption and obesity (2). animal studies have shown that ad libitum consumption of NSBs leads to increased body weight (3, 4), and short-term studies of food intake regulation have suggested that consumption of energy-yielding beverages may be poorly compensated (5). Yet, at the same time, there are epidemiologic studies (6-9), animal studies (10-13), and short-term physiologic or behavioral studies (14, 15) that do not show such associations or effects. Recently published critical reviews and formal meta-analyses on the role of NSBs in overweight and obesity have yielded discrepant findings (16-20). One meta-analysis concluded, “We found clear associations of soft drink intake with increased energy intake and body weight” (17), whereas another stated, “The quantitative meta-analysis and qualitative review found that the association between SB [NSB] consumption and BMI [body mass index; kg/m2] was near zero, based on the current body of scientific evidence” (18).
How do we move forward from this quandary? As proposed in a recent commentary (1), there are different paths for different purposes. For those engaged in clinical practice or setting public health policy, overweight and obesity are immediate problems demanding action, and decisions must be made based on the totality of the available evidence. Faced with imperfect knowledge, both fields rely on professional judgment guided by evaluation of potential risks and benefits. Much to the frustration of consumers, recommendations have changed, as they should, when new knowledge provides insights relevant to the association between NSB consumption and weight management or the risks associated with varying levels of intake. The challenge to researchers is to provide the substrate upon which clinical and public health decisions are made, namely sound scientific evidence, and to do so as objectively, thoroughly, and efficiently as possible. It is to this purpose that we undertook the present critical review of the published randomized controlled trials (RCTs). We focus on RCTs because they are the only studies that can control for both known and unknown confounders and are an especially persuasive force to resolve controversy about the effects of interventions. As the US National Institute of Diabetes and Digestive and Kidney Diseases (21) stated, “Well conducted clinical trials are the fastest and safest way to find improved [obesity] treatments and preventions…”.
Assessment of the experimental literature that had been included in prior evidence-based reviews indicated that the experimental studies previously evaluated did not target a common hypothesis, address a common research question, or estimate a common parameter. As such, we question whether there was ever justification for jointly meta-analyzing these experimental studies en masse as they were meta-analyzed. We recognize that concerns about heterogeneity are omnipresent in meta-analyses and do not mean to imply that meta-analyses cannot appropriately model heterogeneity, such as diverse subject populations, study designs, outcome measurement procedures, etc. However, this is quite different from meta-analyzing studies that address fundamentally different questions. Although it is mathematically possible to average estimates of completely different parameters, it is not clear that it is meaningful to do so nor what the final average estimate would represent. Herein, we meta-analyze two sets of studies separately that we believe address a common hypothesis within each set.
METHODS
Questions to be addressed
To identify which hypotheses or research questions could be addressed, and to further clarify which articles should be included, we evaluated both the previously reviewed experimental literature and several additional relevant studies. Table 1 (22-36) lists the questions or hypotheses that could potentially be addressed by each study and the rationale for excluding some studies from the present review.
Table 1.
Studies included or rejected from final consideration and the questions they address
| Reference | Question that can be addressed regarding the effects of NSBs on weight |
Further analyzed in this review? (Comments) |
|---|---|---|
| Studies Identified in Past Reviews | ||
| Tordoff & Alleva (1990), (22) | What is the effect of being required to ingest at least 36 oz (530 kcal) [1064 mL (2219 kJ)] of regular (i.e., nutritively sweetened) soda per day compared with at least 36 oz of non-caloric soda per day and not being allowed to consume any NSBs? |
Yes. |
| DiMeglio & Mattes (2000), (23) | What is the effect of being required to ingest a fixed amount of NSBs compared with being required to ingest equivalent calories of roughly the same macronutrient composition in solid form? |
Yes. The form of sweetener was not matched other than it was carbohydrate. |
| Grandjean, et al. (2000), (24) | None. This study can address only the question, “What is the effect of different beverages, including various combinations of caffeine, energy, and other factors on hydration in short-term controlled conditions?” |
No. This was a study of essentially 1-d treatment periods in which variations in weight were used as proxies for, and most likely reflected, hydration status. Diet was fixed. This study provides no information on effects of habitual consumption of NSBs on adiposity. |
| Raben, et al. (2002), (25) | None. This study can address only the question, “What is the effect of required ingestion of no less than a specified amount of both solid and liquid items containing sucrose vs. required ingestion of both solid and liquid items containing non-caloric sweeteners?” |
No. This was not a test of solid versus beverage, only compensation for different sweeteners presented in both solid and beverage food forms. |
| James, et al. (2004), (26) | What is the effect of providing vs. not providing a school-based educational program designed to discourage ingestion of sugar-sweetened carbonated beverages? None. |
Yes. |
| Van Wymelbeke, et al. (2004), (27) | No. This is a complicated design intended to assess flavor-energy associative learning. Participants received energy- yielding beverages and non-energy- yielding beverages alternating on a daily basis disallowing one to compare weight changes between NSB and non-NSB conditions. |
|
| Ebbeling et al (2006), (28) | What are the effects of a program aimed at decreasing consumption of NSBs consisting of home delivery of free non-caloric beverages, instructions to drink the non-caloric beverages and not to buy or drink NSBs, and advice on how to choose non-caloric beverages when not at home, weekly contact from a motivational councilor, a printed program materials vs. the instruction to simply continue one’s beverage consumption habits? |
Yes. The study is confounded by the additional attention, counseling, and materials provided to the NSB reduction group. |
| Additional Studies We Identified | ||
| Addington (1988), (29) | What are the effects of consuming, in addition to one’s usual diet, 12 oz (355 mL) daily of NSBs vs. 12 oz of water or 12 oz of a nearly non-caloric aspartame-sweetened beverage? |
Yes. |
| Haub, et al. (2005), (30) | What are the effects of being required to drink beverages containing 150-250 kcal (628-1047 kJ) plus calcium per day vs. no such requirement? |
Yes. The study is confounded by the inclusion of calcium. |
| Munoz (2006), (31) | What are the effects of a brief intervention program aimed at decreasing consumption of NSBs consisting of providing a 1-page information sheet and 5-question quiz compared with simply providing an equivalent amount of information about the hazards of obesity and with providing no information at all? |
Yes. |
| James, et al. (2007), (32) | What is the effect of providing vs. not providing a school-based educational program designed to discourage ingestion of nutritively sweetened carbonated beverages? |
Yes. Follow-up to James, et al. (2004) study (26). |
| Reid, et al. (2007), (33) | What is the effect of being required to ingest at least 1800 kJ/d (430 kcal) of NSBs compared with being required to ingest an equivalent volume of nearly non-caloric (67 kJ/d; 16 kcal) beverages in addition to one’s regular diet? |
Yes. |
| Williams, et al. (2007), (34) | What are the effects of a reduced energy diet prescription disallowing caloric beverages (except milk) compared with an otherwise equivalent diet prescription allowing one to choose 12 oz (355 mL) of regular soda in any day as a snack if desired? |
Yes. This study is essentially a test of the effect of allowance of NSBs in the diet on adherence to a fixed prescribed energy intake (or on other components of energy balance). |
| Sichieri, et al. (2008), (35) | What are the effects of a school-based healthy lifestyle education program including simple messages regarding the importance of drinking water and encouraging water consumption instead of NSBs? |
Yes. |
| Albala, et al. (2008), (36) | What are the effects of a program to deliver milk beverages to the homes of overweight and obese children to displace NSBs? |
Yes. |
Identification of studies
Studies were first identified through other recent evidence-based reviews that examined the broader literature of NSBs and obesity (16-18, 37-42). We supplemented this with thorough searches of PubMed, PsycINFO, the Cochrane Collaborative Website, Web of Science, and Dissertation Abstracts to identify additional sources, including recent and unpublished sources that may not have been included in the earlier reviews. Databases were searched through January 2009. No sources were excluded on the basis of language. Search terms included “sugar sweetened beverage,” “soda,” “liquid calories,” and “chocolate milk,” among others. Example search terms used in PubMed: “BMI” OR “body mass index” OR obes* OR overweight OR “weight gain” OR adipos* OR “body fat” AND beverag* OR “soft drink” OR “soft drinks” OR soda OR liquid. Our inclusion criteria for studies were as follows:
the study involved comparison of outcomes between subjects assigned to 2 or more conditions that differed only in the extent to which the subjects were required, asked, or encouraged to consume or not consume NSBs. We chose to use the term nutritively sweetened beverages rather than sugar-sweetened beverages because we were interested in the property of delivering energy or not and not the source of the energy. We defined an NSB as something one drinks (as opposed to, for example, a liquid soup eaten with a spoon) to which a nutritive sweetener has been added. Regular sodas, fruit punches, and chocolate milks qualified as NSBs, whereas diet soda, 100% fruit juice, and unsweetened milk did not. We also did not include any studies of alcoholic beverages or beverages consumed as meal replacements (e.g., Slim-Fast; Slim-Fast, Englewood, NJ) or growth promoters (e. g., Ensure; Abbott Nutrition, Columbus, OH);
the subjects were humans;
assignment to conditions was randomized;
an outcome variable was body weight, BMI, obesity or overweight status, percent body fat, or some other indicator of adiposity;
the study duration was at least 3 wk;
subjects were not pregnant, acutely ill, or under severely stressed conditions (e.g., soldiers in field exercises, sugar cane harvesters in intense heat, etc).
See Figure 1 for a flow chart of the studies screened and selected for final analysis.
Figure 1.

Study screening and selection process
Outcome measures
The outcome measures we considered were any indices of or proxies for adiposity, including weight, BMI, percent body fat, or dichotomous indicators of overweight or obesity. Although other outcomes such as reported hunger or energy compensation in preload studies are informative, they do not offer direct evidence related to the effects of NSBs on adiposity.
Statistical analysis
Initially, we considered conducting a formal meta-analysis on the totality of the studies meeting our inclusion criteria. However, review of the studies listed in Table 1 indicated that doing so was not justified. From our perspective, the questions addressed by the different studies were so disparate that there was no common parameter being estimated. We did calculate an effect size for each study to characterize the magnitude of effect, and we provide an indication of its statistical significance. Because the outcome measures used (e.g., change in BMI versus change in BMI z-score, log versus non-log transformed) varied and were not comparable across studies, we used the standardized mean difference (43) as an effect size indicator. Our analysis provides this descriptive and inferential statistical information for each study; a narrative and tabular review of the studies’ designs, results, limitations, and justifiable conclusions; and for 2 subsets of studies that addressed sufficiently common questions, we performed a formal meta-analyses. Forest plots were generated with Review Manager, version 5 software (44).
Risk of bias assessment
To assess study level risk of bias, two authors independently reviewed the included studies using the guidelines contained in the Cochrane Handbook for Systematic Reviews of Interventions (45). Disagreements in ratings were discussed until consensus was reached. Risk of bias detail and summary figures were generated with Review Manager, version 5 software (44).
RESULTS
The extent of the data available: studies included and excluded
See Figure 1 for a flow chart of the screening and selection of studies. The relevant data from all experimental studies included in previous reviews and the additional studies we identified are summarized in Table 1. For reasons explained below, we have excluded three of the studies listed in Table 1 that previous reviews have, in our opinion, erroneously considered to be experimental assessments of the effects of NSBs on weight or adiposity. This left us with a total of 12 studies (Table 2), which includes one study that assessed the effects of liquid versus solid energy consumption (23), 4 studies that assessed the effects of adding mandatory NSB consumption to persons’ diets (22, 29, 30, 33), 6 studies that assessed the effectiveness (as opposed to efficacy) (43) of applied programs aimed at decreasing NSB consumption (26, 28, 31, 32, 35, 36), and 1 study that assessed the relative effectiveness of a weight-reducing, energy-restricted diet that disallowed consumption of NSBs and a comparable diet that allowed consumption of up to 12 oz (355 mL) of NSB per day (34).
Table 2.
Descriptive information on the experimental studies included
| Reference | N | Duration (wk) |
Subjects | BMI | Design | Intervention | Method of randomization |
Compliance | Comments |
|---|---|---|---|---|---|---|---|---|---|
| Studies Identified in Past Reviews | |||||||||
| Tordoff & Alleva (1990), (22) |
30 | 3 | Adults | female, 25.4 ± 25.1 male, 25.1 ± 0.5 |
Crossover | Mandated consumption, No restrictions; Drink with high intensity sweetener – 13 kJ Drink with high- fructose corn syrup– 2219 kJ No Drink – 0 kJ |
Not specified | Participants informed compliance would be checked via urine samples, but this was not done |
Significant gain with high- fructose corn syrup relative to aspartame or no drink control |
| DiMeglio & Mattes (2000), (23) |
15 | 4 | Adults | 21.9 ± 2.2 | Crossover | Mandated consumption, no restrictions; NSB - 1880 kJ Jelly beans – 1880 kJ |
Alternate assignment (strictly speaking not truly randomized) |
Diet recall | Significant gain with NSB, not with food; NSB vs. food NS |
| James, et al. (2004), (26) |
644 | 52 | Children (7- 11 y) |
17.6 ± 0.7 17.4 ± 0.6 (lean, overweight/ obese) |
Parallel | Multi- component ‘Ditch Fizz’ education campaign; Attention placebo; Encouraged to reduce sugar and diet carbonated beverages |
Cluster randomized with random number table |
None | No change of mean BMI, only %>91st% - due mostly to increase in control, not decrease in intervention. |
| Ebbeling, et al. (2006), (28) |
103 | 25 | Adolescents (13-18y) |
Intervention, 25.7±6.3 Control 24.9±5.7 |
Parallel | Home delivery of non-caloric beverages to replace NSB |
Stratified, blocked randomization |
Diet recall | No significant change in BMI between intervention and control subjects. Significant change in BMI only observed in upper BMI baseline tertile. |
| Addington, (1988), (29) |
70 | 4 | Women | % body fat W, 25.1 ± 0.9 A, 27.3 ± 1.4 S, 27.2 ± 1.2 |
Parallel | Mandated consumption, No restrictions 837 kJ 0 kJ high- intensity sweetener (aspartame) Water |
Computer generated randomization |
Controlled intake |
Detecting an effect would depend on group differences in energetic compensation |
| Haub, et al. (2005), (30) |
41 | 52 | Post- menopausal women |
% body fat intervention, 43.0 ± 7.3 control, 43.1 ± 5.5 |
Parallel | Intervention group consumed 591 mL/d of a beverage containing milk (7%) and fruit juice (15%). Each serving contained 60- 100 kcal/8 oz (251-419 kJ/237 mL); women consumed ~180 kcal/d (~754 kJ/d) from beverage (personal communication, M. Haub, December. 2007). Control group continued usual lifestyle |
Stratified randomization; exact details not specified |
Weekly consumption reports |
No differences between groups in changes in body weight or body fat |
| Munoz (2006), (31) |
303 | 4 | Adults | 24.06 ± 4.6 (range: 16.4-44) |
Parallel | Anti-soda education |
Not specified | None | The intervention program did not affect NSB consumption, so no effect on adiposity would be expected |
| James, et al. (2007), (32) |
434 | 156 | Children (10-14y) |
intervention, 19.0 ± 3.2 control, 19.7 ± 3.4 |
Parallel | Multi- component Ditch Fizz’ education campaign; Attention placebo; Encouraged to reduce sugar and diet carbonated beverages |
Cluster randomized with random number table |
None | 3-year follow- up to James, et al., 2004. Difference in prevalence of overweight seen at 12 mo was not sustained at 3 y. |
| Reid, et al., (2007), (33) |
133 | 4 | Women | 22.5 ± 2.8 (range: 17- 24.9) |
Parallel (2×2×2) |
1800 kJ/d 67 kJ/d |
Stratified based on “watcher or non- watcher of their weight.” Exact method of randomization not specified |
Participants informed compliance would be checked via urine samples, but this was not done |
No significant effect on weight gain, but more women gained with sucrose and more women lost with high- intensity sweetener |
| Williams, et al., (2007), (34) |
32 | 12 | Adolescent girls (11-15y) |
>95% BMI | Parallel | Fixed 628 kJ | Not specified | Food diaries | This was a controlled energy trial so detecting an effect would depend on group differences in energy compensation |
| Sichieri, et al., (2008), (35) |
1140 | 39 | Children (9-12y) |
Intervention, 18.3 ± 3.6 Control, 18.2 ± 3.2 |
Parallel | Healthy lifestyle education program, including simple messages regarding importance of drinking water and encouraging water consumption instead of NSBs |
Schools cluster randomized, generated by blocking of 4 schools (schools ranked on the prevalence of overweight and obesity) |
24-hour recalls | BMI increased slightly in both groups, with no significant difference |
| Albala, et al., (2008), (36) |
98 | 16 | Children (8-10) |
Intervention, 22.5 ± 0.29 Control, 22.3 ± 0.39 |
Parallel | Nutritionist visited homes weekly to deliver milk beverages, provide instructions to the family about consuming the delivered beverages, and encourage parents to remove NSBs from their homes. |
Computer- generated random numbers; stratified by height-for-age z -score |
Food frequency questionnaires |
Changes in percentage body fat (the primary endpoint) and BMI did not differ significantly between the groups |
NSB = nutritively sweetened beverage
Rationale for omitting three studies included in previous reviews
Three studies (24, 25, 27) included in prior evidence-based reviews of soft-drink or NSB consumption and obesity [i.e., the reviews conducted by Malik, et al. (16), Vartanian, et al. (17), Olsen and Heitmann (20), and Pereira (46)] are not included here. Our rationale for excluding them follows.
The study by Grandjean, et al. (24) consisted of essentially 1-d treatment periods in which variations in weight were used as proxies for, and most likely reflected, hydration status rather than information on the effects of the habitual consumption of NSBs on adiposity. Moreover, were this study included, then previous reviews (17) containing the Grandjean, et al. article also should have included other studies assessing hydration [e.g., a study by Saat, et al. (47)].
In the study by Raben, et al. (25), the independent variable to which the subjects were randomly assigned was not one that permitted inferences about NSB consumption, but rather about sweeteners. Specifically, Raben, et al. addressed the question, “What is the effect of required ingestion of no less than a specified amount of both solid and liquid items containing sucrose versus required ingestion of both solid and liquid items containing non-caloric sweeteners?” This was not a test of nutritive sweetener-containing solid food versus beverage or of NSB consumption versus non-NSB consumption, because the sweeteners were presented in both solid and beverage food forms. Hence, Raben, et al. wrote, “In conclusion, predominantly female overweight subjects who were given supplemental drinks and foods containing sucrose for 10 wk experienced increases in …body weight…. This was not observed in a similar group of subjects given similar drinks and foods containing artificial sweeteners” (25). The authors venture that this was most likely due to “the use of large amounts of beverages, giving rise to overconsumption of energy on the high-sucrose diet.” This is a plausible claim, but not one able to be substantiated from the data because the study was designed to test the broader question noted above.
Finally, Van Wymelbeke, et al. (27) used a complex design intended to assess flavor-energy associative learning. Participants received energy-yielding beverages and non-energy-yielding beverages alternating on a daily basis. Again, this is a useful study, but it was not designed to allow (nor was it intended to allow) definitive claims founded on a valid comparison of weight changes between NSB and non-NSB conditions. Hence, we excluded these 3 studies because they were not experiments of the effects of NSBs on weight or obesity.
Findings on solid carbohydrate vs. liquid NSB consumption
We identified only one study that permitted a direct comparison of the consumption of an NSB with that of an energy-matched solid carbohydrate food form (23). That trial provided 1880 kJ/d of commercial sodas or jelly beans to 15 adults (mean BMI = 21.9 ± 2.2 kg/m2) and monitored energy intake and body weight change over 4 wk in a randomized crossover design. Precise dietary compensation was noted with the jelly beans (118%), and little was observed with the soda (−17%). Body weight and BMI increased significantly after ingestion of the soda, but not with the jelly beans.
Although the findings are indicative of an NSB-specific effect, such a conclusion must be drawn cautiously. The changes in weight and BMI did not differ significantly between the 2 interventions, and several methodological issues may be relevant. First, there was no control for energy source, so it cannot be concluded that carbohydrate has any unique effect. Indeed, other work challenges this view (5, 48). Second, there was no attempt to control when or how the loads were ingested, and 82% of the time the jelly beans were consumed as “snacks,” whereas this held for only 49% of the use of the sodas. Thus, it is unclear if or how these patterns of use affected the outcome. Some evidence suggests it could have augmented the differential response (49, 50).
Finally, this was more of an efficacy than an effectiveness trial (i.e., daily consumption of the loads was required), so extrapolation to free-living conditions, where intake may be more moderate and intermittent, is uncertain. These limitations notwithstanding, this lone trial contrasting food forms does implicate NSBs in weight gain.
Findings on adding mandatory consumption of NSBs
Four studies assessed the effects of adding mandatory NSB consumption to persons’ diets (Table 3) (22, 29, 30, 33). The added daily energy loads ranged from ~180 kcal to 530 kcal (~754 kJ to 2219 kJ). The time periods ranged from 3 wk to 1 y. Sample sizes ranged from less than 30 to133. For 5 of 5 estimates from the 4 studies (separate estimates for males and females were available in 1 study), the results were in the direction of mandatory NSB consumption leading to greater weight gain than control conditions. However, the results were statistically significant in only 2 studies (22, 33).
Table 3.
Studies assessing the effects of adding mandatory NSB consumption to persons’ diets
| Study | Daily Energy (kcal) |
Duration | Effect Size (ΔNSB − Δcontrol)1 in kg |
SE effect size |
Comments |
|---|---|---|---|---|---|
| Tordoff & Alleva (1990), (22) |
530 | 3 wks | Female: 0.72 Male: 0.99 |
0.38 0.32 |
Numbers used here are from text and were confirmed to be correct by Tordoff (personal communication, July 2008). SEs conservatively calculated assuming independence of condition (i.e., ignoring crossover design). Condition used is NSB vs. aspartame (not ‘no drink’). |
| Addington, (1988), (29) |
200 | 4 wks | 0.09 | 0.36 | Inputs taken from Addington’s Table 2. Condition used is NSB vs. aspartame vs. water (not ‘no drink’). |
| Haub, et al. (2005), (30) |
150 – 250 | 12 mos | 0.50 | 1.03 | Inputs taken from Haub’s Table 1. Condition used is NSB vs. no drink. |
| Reid, et al., (2007), (33) |
430 | 4 wks | 0.53 | 0.23 | Data for this table provided by Reid (personal communication, January 8, 2008). Condition used is NSB vs. diet beverage, sweetener not stated (not ‘no drink’). |
Δ = final weight – baseline weight; NSB = nutritively sweetened beverage
Meta-analytic/Quantitative Integration of Mandatory NSB Consumption Studies
The 2-tailed probability of obtaining 5 out of 5 independent results in the same direction if there is no effect in any of the populations sampled is 0.0625, which is marginally significant. The nature of these ‘efficacy’ studies, where dose is essentially well-controlled (unlike the effectiveness of NSB reduction trials reviewed below), lends well to a meta-analytic approach based on dose response. In Figure 2, we plot the 5 estimates of effect against the daily required energy of NSB consumption. All studies reported the outcome in absolute weight gain, permitting use of weight gain in kg as an outcome (effect size) metric. Hence weight gain was regressed on NSB dose expressed in kcal in a weighted least squares (WLS) regression with each study’s weight equal to the inverse of the variance of the estimated effect size. We did not force the regression through the origin as some investigators choose to do in similar nutritional intervention meta-analyses (51), even though a zero change in intake should produce a zero change in outcome. This is because the dose-response relation need not be linear over the entire theoretical range even if it appears approximately linear over the observed range. In such cases, forcing a linear regression through the origin can radically bias the resulting coefficients and also create other well-established interpretive difficulties (52, 53).
Figure 2.
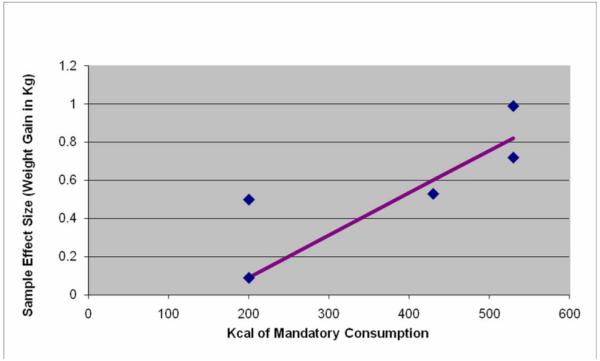
Estimated weight gain effect of mandatory NSB consumption
The meta-regression revealed a dose-response relation (Pearson’s r, with observations weighted by the inverse of their variances = 0.92, P = 0.029) with a slope of .0022 (SE = .00057) and an intercept of −0.357 (SE = .249). Thus, for example, if this adequately represents a causal effect, a 250 kcal daily mandatory consumption load (roughly equivalent to a 20-oz bottle of non-diet soda) would be expected to increase weight roughly 0.2 kg (0.44 lbs) over a 3-to 12-week period. See Figure 3 for a forest plot of the standardized effects for added NSB consumption. Figure 3 should be interpreted with caution, as this representation averages effects over all doses. See Figure 2 for the dose-response relationship of mandatory NSB consumption to weight. Two points are noteworthy here. First, given the possibility of confounding factors across studies, meta-regression dose-response relations may not represent causation and, therefore, should be viewed with caution (54). Second, as noted elsewhere (55), it would be inappropriate to project this forward beyond 12 wk in time by linearly increasing the weight gain per unit time because of compensatory changes in energy expenditure that result from increased body mass.
Figure 3.
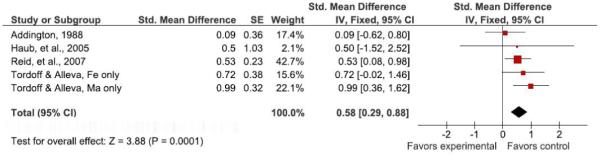
Forest plot comparing studies of added NSB consumption*.
*See meta-regression section for heterogeneity statistics. Figure above does not represent dose-response relationship of added NSBs and weight. See Figure 2 for dose-response graph.
Our interpretation of these studies is that they suggest an effect of mandatory NSB consumption on increasing weight relative to certain controls. However, sample sizes were small and the study durations short, precluding confident inferences. Moreover, it is not clear to what degree these results are dependent on the control condition being either restricted to no NSB consumption or required consumption of non-NSBs. This is an important point from the perspective of clinical and public health recommendations and needs to be explored further.
Findings of effectiveness trials aimed at decreasing consumption of NSBs
Six reports provided information on the effects on adiposity of programs aimed at decreasing consumption of NSBs (26, 28, 31, 32, 35, 36). One of these reports was a longer-term follow-up of the same subjects studied in 2004 (32). These studies ranged in duration from 4 wk to 52 wk with a follow-up at 3 y from baseline. Sample sizes ranged from 103 to 1140.
The James, et al. studies (26, 32)
The first such study was the cluster-randomized RCT of James, et al. (2004) (26). These authors studied children aged 7 to 11 y in 6 junior schools in the United Kingdom. The outcome measures were anthropometric measurements. The first author (James) delivered the intervention to all classes. According to the authors, the main objective “was to discourage the consumption of ‘fizzy’ drinks (sweetened and unsweetened) with positive affirmation of a balanced healthy diet. [Children]… were told that by decreasing sugar consumption they would improve overall wellbeing and that by reducing the consumption of diet carbonated drinks they would benefit dental health.” Children in the treatment group were provided four psycho-educational sessions during the course of the school year; “teachers were encouraged to reiterate the message in lessons,” and “children were also encouraged to access further information through the project’s website.” There is no statement that the control group received comparable attention or non-treatment intervention.
At 12 mo, while consumption of carbonated drinks decreased in the intervention group compared with the control group (mean difference 0.7, 0.1 to 1.3 glasses/d), there was no significant difference in BMI change by treatment assignment. There was, however, a significant difference in change in the proportion of children who exceeded a cut-off used to define overweight or obesity. Specifically, the percentage of overweight and obese children increased in the control clusters by 7.5%, compared with a decrease in the intervention group of 0.2% (mean difference 7.7%, 2.2% to 13.1%). Three years after baseline and two years after the active intervention [James, et al., 2007; (32)], mean BMI had increased in both the intervention and control groups, and the difference in change in BMI between the groups was not statistically significant (1.88 ± 1.71 and 2.14 ± 1.64 kg/m2, respectively, P = 0.12). In addition, the prevalence of overweight increased in both groups at 3 y, and the significant difference in this measure between the groups seen at 12 mo was no longer evident.
An apparent shortcoming of these studies was the lack of an attention placebo in the control group. Control group subjects did not receive educational sessions nor were they offered access to the project website. Thus, it is not clear whether the effects observed were due to reduction in NSB consumption or other nonspecific factors and intervention components that were allowed to be perfectly confounded with treatment assignment. Yet an additional concern is the lack of indication as to whether the dichotomous analysis that showed some efficacy (while the analysis of BMI as a continuous variable did not) was pre-planned or post-hoc (56). We were unable to ascertain whether this was specified a priori in the protocol.
Ebbeling, et al., 2006 (28)
For 25 wk, Ebbeling, et al. studied 103 ostensibly healthy, non-dieting, non-smoking adolescents who reported consuming at least 360 mL/d of NSBs and had BMIs above the population 25th percentile (28). Subjects were individually randomly assigned to intervention or control conditions, and all subjects were available for endpoint measurements. The intervention group received weekly home deliveries of self-selected, non-energy-yielding beverages throughout the study and were told to drink the beverages provided and not to buy or drink NSBs. Additional non-energy-yielding beverages also were provided for family members to avoid competition between the subjects and family members for the beverages. Intervention subjects also received advice on how to choose non-energy-yielding beverages when not at home, written instructions regarding beverage consumption, monthly mailed refrigerator magnets with informational and motivational slogans, and monthly phone calls from study staff to provide “motivational counseling.” Control group subjects were asked only to continue their usual beverage consumption habits.
The change in BMI, adjusted for sex and age, was 0.07 ± 0.14 kg/m2 (mean ± SE) in intervention subjects compared with 0.21 ± 0.15 kg/m2 in control subjects. The net difference in change in BMI between the groups (−0.14 ± 0.21 kg/m2) was not statistically significant. Baseline BMI was a significant effect modifier; the intervention effect was significant in subjects with a baseline BMI >30 kg/m2. Among subjects above the upper tertile of BMI at baseline (BMI ≥25.6 kg/m2), the change in BMI between the 2 groups differed markedly: −0.63 ± 0.23 kg/m2 in the intervention group and +0.12 ± 0.26 kg/m2 in the control group (P = 0.03).
A shortcoming of this study was the lack of an attention placebo in the control group. Control group subjects were asked only to continue their usual beverage consumption habits throughout the 25-week intervention period. They received no written instructions, telephone calls, or refrigerator magnets. Thus, it is not clear whether effects (or lack thereof) observed were due to reduction in NSB consumption or other nonspecific factors and intervention components that were allowed to be perfectly confounded with treatment assignment. Additionally, the authors used a stratified randomization procedure, but it does not appear that they took the stratification into account in the subsequent statistical modeling, as would be standard practice (57). Moreover, although Ebbeling, et al. indicate their subgroup analysis was pre-planned (58), it is curious that they stratified on one BMI threshold, yet used a different BMI threshold in their analysis of high-BMI children only. The subgroup analysis showed a significant effect, whereas the analysis of BMI in the entire sample showed no effect of treatment assignment. A replication and extension study is currently underway (see http://clinicaltrials.gov/ct2/show/NCT00381160?term=beverages&rank=1).
Munoz, 2006 (31)
This doctoral dissertation reports on the effectiveness of a brief intervention to reduce soda consumption in a college population (31). A total of 303 university undergraduate students (who received course credit for participating) were included. The only inclusion criterion was current consumption of non-diet sodas. Subjects were randomly assigned to 1 of 3 groups: 1) a group that received information on the health risks associated with soda consumption (including type 2 diabetes mellitus, calcium deficiency, and dental ailments; n = 111), 2) a group that received information on the obesity risks associated with soda consumption (n = 95), or 3) a control group that received no information (n = 97). Weight and height were measured at baseline, after which the intervention subjects received their respective intervention handouts. These included research-based information on how to reduce soda consumption for improved health and weight, along with a 5-question short-answer quiz at the end to help ensure that the handouts were read by the subjects. No further intervention activities occurred. A single follow-up visit occurred 1 month after the baseline visit.
Soda consumption decreased significantly in all groups over the 1-month study period, with a nearly equal mean reduction of approximately 16 oz/d (355 mL/d) in both intervention and control groups. BMI increased in all 3 groups between baseline and the follow-up visit, with soda consumption showing no association with BMI at the follow-up visit in any group.
Given the null findings of this study, it is important to consider those factors that may have contributed to, or at least led to failure to control for, extraneous variance in the data and thereby reduced power and precision. Inclusion criteria were poorly defined, with the only stated criterion being current consumption of non-diet sodas, of which a minimum amount was not specified. Potential subjects apparently were not screened for health problems, current weight-loss diets, or other factors that may have affected weight change. It is not apparent that the randomization took baseline BMI into account. There was no attention placebo in the control group, nor did control subjects receive study handouts. Both interventions were minimal (consisting only of 1-page handouts delivered on one occasion), and the intervention period was short.
Sichieri, et al., 2008 (35)
This school-based cluster randomized trial conducted in Niteroi, Rio de Janeiro, Brazil evaluated whether an educational program aimed at discouraging students from drinking NSBs could prevent excessive weight gain. Forty seven classes in 22 schools were randomized as intervention or control. Participants were 1140 fourth graders (age 9 to 12 y), including 526 in the intervention group and 608 in the control group (6 randomly assigned subjects did not have baseline measures). The intervention consisted of a healthy lifestyle education program, including simple messages regarding the importance of drinking water and encouraging water consumption instead of NSBs. The main strategies were to convey the messages that drinking water is positive and that water should take precedence over NSBs. Education was delivered via classroom activities (10, one-hour sessions of activities facilitated by trained research assistants), musical activities (three, 1-hour sessions), and printed materials given to intervention subjects. In addition, banners were hung promoting water consumption, and water bottles with the logo of the campaign were given to children and teachers at the intervention schools. The control group received only two, 1-hour general sessions on health issues and printed general advice regarding healthy diets. The main outcome was change in BMI measured at the beginning and at the end of the school year.
Mean follow-up time was approximately 8 mo in both groups, with 82.5% of intervention and 81.1% of control students having repeat measurements at follow-up. At the conclusion of the study (end of the school year), there was a reduction of 69 ml in the intervention group and of 13 ml in the control group (P < 0.05), accounting for about a 100-kJ/d difference. However, BMI increased slightly in both groups (by 0.32 kg/m2 in the intervention group and 0.22 kg/m2 in the control group; NS). In a subgroup analysis, girls who were overweight at baseline showed a statistically significant reduction in BMI. Overall, the prevalence of obesity changed from about 4% to 4.5% in both groups. A shortcoming of this trial was the lack of an appropriate attention placebo. Subjects in the control group received 2 hours of general health information, compared to 10 hours (plus 3 hours of musical activities) in the intervention group.
Albala, et al., 2008 (36)
This 16-week RCT examined the effects on body composition of delivering milk beverages to the homes of overweight and obese children to displace NSBs. In this study, 98 children aged 8-10 y, who regularly consumed NSBs, were randomly assigned to an intervention or control group. Children in the intervention group were visited by a nutritionist in their homes weekly to deliver milk beverages, provide instructions to the family about consuming the delivered beverages, and encourage parents to remove NSBs from their homes. Children were counseled to drink 3 portions per day of the milk beverages. Intervention children were encouraged to take the milk beverages to school for consumption during lunch and instructed not to consume NSBs. Milk beverages also were supplied to siblings of intervention subjects, and household members were encouraged to support the subjects by not drinking NSBs. No instructions were given to subjects regarding food or beverage choices in the control group, nor was there any contact with them, other than to conduct assessments.
Milk consumption increased by approximately 450 g/d for the intervention group (P < 0.0001) and did not change for the control group. Consumption of NSBs decreased in the intervention group by 96% (P < 0.0001) and increased in the control group by 9% (P = 0.04). However, changes in percentage body fat (increase of 0.36% in the intervention group and increase of 0.78% in the control group) and BMI (increase of 0.08 kg/m2 in the intervention group and decrease of 0.09 kg/m2 in the control group) were small and did not differ significantly between the groups, although accretion of lean mass was slightly greater in the intervention group than in the control group (P = 0.04).
As in many of the studies reviewed above, an apparent shortcoming of this study was the lack of an attention placebo in the control group. Control subjects did not receive visits from study personnel and, in fact, were not contacted at all except to conduct assessments. That being said, given the null findings, this is not a major concern. In addition, a proper intent-to-treat analysis was not conducted. One might argue that the Albala trial is not relevant to questions of NSB consumption on weight under the supposition that if one replaces NSB consumption with another energy-yielding beverage, energy balance and therefore body weight may not be affected. This supposition may or may not be correct. Nevertheless, this study is informative about the effects of encouraging children to consume milk in place of NSBs.
Narrative Summary of RCTs for NSB Reduction
In summary, the primary question addressed in these trials was whether an educational intervention could affect a reduction in NSB consumption. Changes in indices of adiposity were secondary outcomes in most of these studies. The lack of comparable intervention activity in the control groups and the short duration of some trials hampers interpretation of the primary endpoints, let alone the secondary outcomes. The finding of a greater effect size among overweight subjects in one study (28) and overweight girls in another study (35), who may be at increased risk of health complications, is noteworthy and is addressed more thoroughly in the meta-analyses below.
Meta-analytic/Quantitative Integration of NSB Reduction Effectiveness Studies
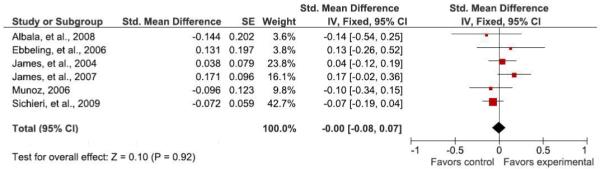
Table 4 contains a summary quantifying the effect size for all NSB reduction effectiveness studies and Table 5 provides the results of our meta-analysis. As an outcome variable, we chose change in BMI because it was commonly reported across all studies. In studies of children that reported age-adjusted z-scores of BMI, we used those. For our primary analysis, we analyzed all studies except that of James, et al. (2007) (32) because that was not independent of the James, et al. (2004) (26) study and was different from others in that it was a study of a long-term post-intervention follow-up. We used the standardized mean difference (also known as Cohen’s d) as an effect size metric to allow us to integrate studies that used raw BMI units and also z-scores of BMI. We scaled the effect size such that positive numbers meant the study favored the treatment group (i.e., that those on treatment had smaller increases in BMI or reduced BMI more than those in the control group). See Figures 4 - 5 for forest plots of the sub-group comparisons of standardized effects for reduced NSB consumption.
Table 4.
Effect sizes from studies assessing the effect of attempting to get people to reduce or eliminate NSB consumption on body mass index
| Standardized Effect Size (d) | ||||||
|---|---|---|---|---|---|---|
| Reference | N | Effect Size (Standardized mean difference) |
SE | Lower Limit of 95% CI |
Upper Limit of 95% CI |
Variable2 for which effect size is calculated |
| James, et al. (2004), (26) |
644 | 0.038 | 0.079 | −0.116 | 0.193 | zBMI3 |
| Ebbeling, et al. (2006), (28) |
103 | 0.131 | 0.197 | −0.255 | 0.518 | BMI (adjusted for age and sex) |
| Munoz (2006), (31) | 303 | −0.096 | 0.123 | −0.337 | 0.146 | BMI |
| James, et al. (2007), (32) |
434 | 0.171 | 0.096 | −0.017 | 0.360 | zBMI |
| Sichieri, et al., (2008), (35) |
1140 | −0.072 | 0.059 | −0.188 | 0.044 | BMI |
| Albala, et al., (2008), (36) |
98 | −0.144 | 0.202 | −0.541 | 0.252 | zBMI |
All variables are change scores, i.e., changes in the variable from baseline to endpoint.
zBMI denotes z-scores of body mass index standardized for age.
Table 5.
Meta-analytic integration of studies assessing the effect of attempting to get people to reduce or eliminate NSB consumption on body mass index
| Standardized Effect Size | ||||||
|---|---|---|---|---|---|---|
| Studies Used | Effect Size (Standardized mean difference) |
Lower Limit of 95% CI |
Upper Limit of 95% CI |
SE |
Q Statistic (df); p- value |
I2 Statistic |
|
Primary Analysis: All Studies except James, et al.(2007), (32) |
−0.037 | −0.120 | 0.046 | 0.042 | 2.51 (4); p=.643 |
0.00% |
| Sensitivity Analysis | ||||||
| All studies | −0.004 | −0.079 | 0.072 | 0.039 | 6.44 (5); p=.266 |
22.36% |
| All studies except Munoz (2006), (31) |
0.007 | −0.073 | 0.086 | 0.041 | 5.82 (4); p=.213 |
322.23% |
| All studies except Munoz (2006), (31) and James, et al. (2007), (32) |
−0.029 | −0.117 | 0.059 | 0.045 | 2.25 (3); p=.522 |
0.00% |
| All studies except Albala, et al. (2008), (36) and James, et al. (2007), (32) |
−0.032 | −0.117 | 0.052 | 0.043 | 2.22 (3); p=.529 |
0.00% |
Figure 4.
Forest plot comparing studies of reduced NSB consumption.*
*See meta-regression section for heterogeneity statistics.
Figure 5.

Forest plot comparing studies of reduced NSB consumption in overweight/obese subjects.*
*See meta-regression section for heterogeneity statistics. NOTE: These were sub-group analysis where data was available.
We conducted a fixed effects meta-analysis as described by Hedges and Olkin (59) with heterogeneity statistics calculated as described elsewhere (60). As can be seen in Table 5, the overall estimate of standardized mean difference in BMI was extremely close to zero (−0.037; SE = 0.042; P = 0.378). The confidence interval was −0.120 to 0.046, indicating the non-significance of the overall effect estimate. The Q or χ2 test of heterogeneity was not significant (P = 0.643) and the I2 statistic, an indicator of the magnitude of among-study heterogeneity in outcome, was 0.00%. These results indicate that there was no statistically significant effect overall; that if they produce an effect at all, it is unlikely that interventions of the types studied to date could produce more than 0.05 of a standard deviation unit lesser BMI change (the upper limit of the 95% CI) in treated versus untreated subjects on average, and that the results appear consistent from study to study.
As a sensitivity analysis, we also repeated the meta-analysis 4 different ways. First, we added the James, et al. (2007) (32) study, despite the fact that it was not independent of the James, et al. (2004) (26) study. Second, we eliminated the study by Munoz (31) because it was an outlier in terms of the minimal nature of the intervention and its brevity. Third, we re-ran the analysis eliminating both the James, et al. (2007) (32) and Munoz (2006) (31) studies. Finally, we reran the analysis eliminating the Albala, et al. (36) study because, as described above, one might argue that the Albala trial is not relevant to questions of NSB consumption on weight under the supposition that if one replaces NSB consumption with another energy-yielding beverage, energy balance and therefore body weight may not be affected. The results of these sensitivity analyses were not appreciably different than that of the primary analysis (see Table 5), lending confidence to the conclusions.
Notably, this meta-analysis assesses the effects of programs aimed at NSB reduction as the primary outcome on a secondary outcome measure, obesity. They were not trials of the effects of NSB reduction per se on obesity. Actual reductions of NSB consumption varied markedly. At least 2 trials (31, 35) achieved only a very minimal change of NSB consumption, so lack of effect on BMI was predictable, and another (36) aimed to substitute milk for NSB rather than just moderate NSB consumption. Thus, the latter might not have been expected to effect a change of weight. The strongest trial methodologically (28) had the largest effect size, although even this was not significant in the study’s total sample.
We next conducted a subgroup meta-analysis. Because, as mentioned above, Ebbeling, et al. (28) had reported significant results in those subjects above the top tertile of baseline BMI and Sichieri, et al. (35) had reported more nearly significant results among subjects overweight at baseline, we tried to conduct an analysis of only subjects exceeding the top tertile (i.e., in the upper third) of the baseline BMI distribution or of a subset deemed overweight at baseline. Such information was already available for Ebbeling, et al. and for Sichieri, et al. We wrote to the remaining authors to request information on an analysis of just subjects in the upper third of the baseline BMI distribution. One author (Munoz) provided the requested analyses. Thus, we were able to meta-analyze only 3 studies in this fashion.
As indicated in Table 6, the overall estimate of standardized mean difference in BMI was 0.349 (SE = 0.071) and was statistically significant (P <0.0001; 95% CI: 0.211 to 0.488). The Q or χ2 test of heterogeneity was not significant (P = 0.468) and the I2 statistic, an indicator of the magnitude of among study heterogeneity in outcome was 0.00%. These results indicate that there was a statistically significant effect overall, that the best estimate is that interventions of the types studied to date could produce roughly a 0.35 standard deviation unit lesser BMI change (i.e., more weight loss or less weight gain) in treated versus untreated subjects who were overweight or in the upper end of the BMI distribution at baseline, and that the results appear consistent from study to study. However, given the possibility that such subgroup analyses are more likely to be reported when they are statistically significant, reporting bias (61-63) may have contributed to this observation, and there is evidence that closely related forms of bias may hold on the topic of NSB consumption and obesity (MB Cope and DB Allison, unpublished observations, 2009).
Table 6.
Effect sizes from studies assessing the effect of attempting to get people to reduce or eliminate NSB consumption on body mass index only for subjects overweight at baseline and/or above the top tertile of baseline BMI
| Standardized Effect Size (d) | ||||||
|---|---|---|---|---|---|---|
| Reference | N | Effect Size (Standardized mean difference)4 |
SE | Lower Limit of 95% CI |
Upper Limit of 95% CI |
Variable5 for which effect size is calculated |
| Ebbeling, et al. (2006), (28) |
34 | 0.757 | 0.355 | 0.061 | 1.453 | BMI (adjusted for age and sex) |
| Munoz (2006), (31) |
116 | 0.345 | 0.079 | 0.190 | 0.501 | BMI |
| Sichieri, et al., (2008), (35) |
139 | 0.273 | 0.171 | −0.061 | 0.607 | Log-transformed BMI (adjusted for age and follow-up) |
| Overall Estimate | 0.349 | 0.071 | 0.211 | 0.488 | ||
Note that for Sichieri, et al. and for Ebbeling, et al., our estimates of the standardized mean differences (but not their statistical significance) may be slightly inflated because the original article did not permit estimation of the degree to which the residual variance in a regression was reduced by covariates in addition to treatment assignment. We therefore ignored this factor which likely led to an underestimation of the pooled, within-group standard deviation in BMI change.
All variables are change scores, i.e., changes in the variable from baseline to endpoint.
Second, one could argue that the entire study by Albala, et al. should be included in this subgroup meta-analysis because all subjects were overweight at baseline. Had we included that study, the overall meta-analytic effect size estimate would remain significant, but would be reduced from 0.349 to 0.285. One might question why the Albala, et al. study did not obtain a statistically significant result in the predicted direction if there is truly an effect of NSB reduction programs on BMI among initially overweight persons. One reason may be the substitution of milk for NSBs as discussed above. The other may be power. Let us assume for the moment that there is a true effect of such programs aimed at NSB reduction on BMI change scores with an effect size of 0.349. In that case, a 2-group parallel-arm RCT with equal allocation to each group and no cluster randomization or dropout would require roughly 263 subjects to have 80% power at a 2-tailed alpha level of 0.05 or roughly 497 to have 90% power at a 2-tailed alpha level of 0.01 [calculated with publicly available software (64)]. Thus, the Albala study may have been markedly underpowered with a sample of only 98 subjects.
Findings of effectiveness trials of energy-restricted diets allowing or disallowing NSB consumption
A study by Williams, et al. (34) evaluated weight loss in overweight adolescents assigned to 1 of 2 dietary interventions differing in the types of snacks allowed. In this 12-week, controlled clinical trial, otherwise healthy but overweight 10-y-old to 16-y-old girls were randomly assigned to either a 1500-kcal/d (6280-kJ/d) free-snack (FS) diet or an isoenergetic restricted-snack (RS) diet. In addition to consuming 3 meals, subjects in the FS group could choose any 150-kcal (628-kJ) item as 1 of their 2 daily snacks, including regular soda (12 oz, 355 mL), if desired. The other snack had to be chosen from a list of “healthy” snacks. Subjects in the RS group also consumed 3 meals and 2 snacks per day; however, both snacks in this group were restricted to the healthy snack list, which included only sugar-free beverages (e.g., diet soda). Treatment in both groups included parent/family support counseling, frequent assessment and monitoring, behavioral counseling, guidelines for dietary intake, and specific physical activity goals. Thirty-two of 38 subjects enrolled in the study (84.2%) completed the 12-week intervention.
In total, 29.4% of the girls in the FS group drank an average of one to two 12-oz servings of regular soda per week, 41% of the girls drank an average of three 12-oz servings of soda per week, and 29.4% consumed a mean of more than 3 servings per week. In the RS group, 16.6% of girls consumed 1 or 2 servings of diet soda per week, 25% consumed a mean of 3 servings per week, and 58.3% consumed more than 3 servings weekly. Mean weekly consumption of regular soda was about 3 servings in the FS snack group, whereas mean weekly consumption of diet soda was slightly more than 4 servings in the RS group.
Weight loss and changes in BMI over the intervention period were similar in both diet groups. The mean weight loss was −1.32 kg in the FS group and −1.22 kg in the RS group. Mean BMI decreased by −1.00 kg/m2 in the FS group and −1.05 kg/m2 in the RS group. The authors concluded that the results of this study showed that both diets were equally effective in achieving a modest amount of weight loss and “that some soda may be included in a teen weight control diet, as long as caloric intake is maintained at recommended levels, and care is taken to achieve adequate intake of essential nutrients.”
This study affirmed the prepotency of total energy on weight change. NSBs exerted no apparent effects over and above their contribution to total energy intake. However, the absence of data on energy expenditure precludes definitive resolution of this issue.
Other studies not meeting the strict inclusion criteria
Several studies did not match our a priori inclusion criteria but are still instructive. In one, 12 healthy, 18-25-y-old men with documented weight stability were provided a daily non-energy yielding sweet beverage supplement (placebo) for 3 wk and a 1000-kcal (4184-kJ) beverage supplement, matched to placebo on sensory properties, for 8 wk (65). All supplements were consumed between 2200 and 2300 hours. The treatment order was not randomized, hence its exclusion from our analysis. Weekly weight change during placebo and supplement consumption was 0.11 pounds (0.05 kg) and 0.86 pounds (0.39 kg), respectively, which was described as a highly statistically significant difference by the authors (no test statistics given). Dietary compensation for the supplement was approximately 50%, so the change in weight was roughly consistent with the estimated excess energy ingested (~500 kcal/d, ~2093 kJ/d). Fixing the time of beverage ingestion to late evening and lacking non-sweet and non-beverage controls precludes attributing the weight gain to any specific property of NSBs.
Another intervention trial with 21 children aged 6-13 y involved monitoring beverage and food intake, as well as body weight, in a camp setting for 4-8 wk (67). The children had unlimited access to water, milk, and a fruit-flavored sweetened beverage. The lack of random assignment accounts for its omission from the present analysis. Milk consumption elicited a weak reduction in solid food intake; the fruit juice was less effective, resulting in an increase of 244 kcal/d (1022 kJ/d). Children consuming >12 oz (355 mL) of fruit beverage per day gained 3.3 ± 1.95 kg, whereas those consuming <6 oz/d (177.5 mL) gained 0.5 ± 0.4 kg (difference not significant). The marked, albeit non-significant, increments in weight gain associated with higher consumption of NSBs or milk are notable, but the design does not permit conclusions about a unique role played by NSBs because the study lacked controls for beverage properties, such as palatability, as well as food form.
A third trial reported stronger dietary compensation than some other trials and no weight change among 28 adults randomly assigned to consume “Irn Bru” or “Diet Irn Bru” (a sweetened [sucrose], citrus-flavored, carbonated and caffeinated beverage) for 7 d (66). However, there was a rank ordering in which children who drank more NSBs gained more weight. The females and males consumed 2.4 ± 0.6 bottles/d (about 240 kcal, 1005 kJ) and 2.9 ± 0.5 bottles/d (about 290 kcal, 1214 kJ), respectively. However, the validity of the diet records was not assessed. Furthermore, the short duration of intervention and small sample size precluded detecting meaningful changes in body weight. The former concern was the basis for excluding the trial from the present analysis.
A fourth trial reported no difference in change in body weight or percent body fat in 63 Marines consuming Unitized Group Rations in addition to unrestricted amounts of either a supplemental carbohydrate beverage (8% maltodextrin) or a supplemental placebo beverage sweetened with a non-nutritive sweetener (aspartame) for 11 d (68). Total daily fluid intake was not different between the groups (placebo group, 7.7 L/d versus carbohydrate group, 7.3 L/d). However, supplemental beverage intake was 30% higher in the placebo group than in the carbohydrate group (placebo group, 3.1 L/d versus carbohydrate group, 2.3 L/d). The short duration of the intervention made the detection of changes in body weight and percent body fat in this study problematic. In addition, study subjects could be considered to have been severely stressed because they were participating in a field artillery exercise under windy conditions and daily temperatures of up to 31.9 °C. This study was excluded from consideration for both of these reasons.
Two recently reported studies also were excluded for different reasons. The first, a clinical trial of the effects of goji juice on general health (including measures of adiposity) (69), was excluded because of the short study duration (14 d). In this study, there was no significant difference in change in BMI in subjects randomized to either a group consuming 120 mL/d of goji juice (n = 16) or to a group consuming an equal amount of placebo control solution (n = 18). The second, a study evaluating the effectiveness of a school-based nutrition education program on nutrition knowledge, attitude, and self-reported behavior (including NSB consumption) (70), was excluded because there was no apparent randomization of the treatment conditions, nor was there any outcome related to adiposity.
Assessment of Study Level Risk of Bias
Figure 6 summarizes our assessment of potential areas of bias in the ways the included studies were conducted and reported. We assessed the various categories of risk based on the available information. It should be noted that the nature of these studies make it very difficult, if not impossible, for participants to be blinded to their randomization group. This should not be interpreted as bias on the part of the design or researchers per se.
Figure 6.

Study-level risk of bias summary table and graph
DISCUSSION
Our meta-analysis shows that the currently available evidence on NSB consumption reduction programs is suggestive, but does not confirm that such programs may be effective, particularly in persons who are overweight or obese at baseline. A well-powered and adequately controlled RCT to test this specific hypothesis is clearly needed.
As stated in the outset of this review, recently published critical reviews and formal meta-analyses on the role of NSBs in overweight and obesity have yielded discrepant findings or conclusions (16-19). Some clarification is required to help resolve this issue and move the field forward. Focusing first on the meta-analyses, they are based on different subsets of the literature. Vartanian, et al. (17) included cross-sectional, longitudinal, and experimental studies, whereas Forshee, et al. (18) limited their analysis to longitudinal studies and RCTs. The effect sizes for the cross-sectional and experimental data are stronger (0.08 and 0.24, respectively) than is the effect size reported by Forshee, et al. (0.017; random effects model), thereby accounting for some of the interpretative difference.
Differences of professional judgment also factor into the discrepant conclusions. Forshee, et al. (18) believed it appropriate to control for energy intake in their analyses, while this has been questioned by others (71) on the grounds that it is the mechanism by which NSBs exert their effect on body weight. If beverages contribute to positive energy balance through weak satiation effects and poor dietary compensation, controlling for energy intake might preclude identification of a treatment effect and account for the different conclusions.
Another important distinction is the focus by Forshee, et al. on studies of children and adolescents. In their analysis of the longitudinal studies, Vartanian, et al. (17) included 3 studies of adults, which yielded an effect size of 0.09 compared with 0.017 by Forshee, et al. (18). In a subgroup analysis by Vartanian, et al., they acknowledge that the association between NSB consumption and BMI was stronger in adults.
Differences in search strategies also apparently yielded different papers for analysis. Most notably, a study included by Forshee, et al. twice in their analysis [boys and girls separately; a study by Mundt, et al., 2006 (72)] had the largest negative effect and was not included in the analysis by Vartanian, et al., which accounted for another increment in the difference in effect sizes. Differences in qualitative analyses and underlying assumptions of the reviews are also notable, because they influence the tone of the reviews. For example, Forshee, et al. (18) questioned the validity of the dietary data from a study reporting a positive association (26), yet argued for the validity of the dietary data in their overall analyses, which concluded there was no meaningful association between NSB consumption and BMI. In contrast, errors in dietary assessment were recognized as a source of potential error in a review emphasizing an association between NSB consumption and BMI (16). Forshee, et al. (18) also remarked that a particular study reporting a positive effect did not use a nationally representative sample (73), yet this limitation applied equally to most of the studies noting no or a negative association. The issue of singling out the one study aside, some might argue that the burden of proof of the validity of measurements lies more heavily with those reporting no effect, because large random error will often (although not always) (74) obscure associations and account for the lack of effect.
Finally, we believe that many of the studies included in these prior reviews were not designed to address the question of whether NSBs contribute to weight gain or hinder weight loss. Instead, they were tests of the role of sweetness, sweeteners, or education on these outcomes. NSBs are an important source of dietary sweetness and sweeteners, but to understand the role of NSBs, they must be contrasted with beverages that are not sweet and do not contain sweeteners as well as with non-beverage sources of sweetness and sweeteners. There appears to be only a single, small, short-term study meeting this criterion (22); obviously an inadequate basis for drawing conclusions.
Our review has several unique strengths. First, we sought out and included unpublished literature to avoid publication bias. Second, by focusing only on the experimental literature, we were better able to address causation as opposed to association. Third, the present approach allowed us to partition the experimental literature into distinct categories that differed in terms of the fundamental questions asked. As a result, we believe we demonstrate that several studies that previous reviewers included in the experimental category or in reviews of NSB effects did not merit inclusion. Fourth, we conducted a meta-analysis specifically in the subset of subjects with high baseline BMI values (i.e., typically those that were overweight or obese).
Our review was limited to selected beverages and their effects on body weight, so the conclusions should not be extrapolated beyond those targeted. Different beverages may well hold varied implications for energy balance (75). For several beverage classes (e.g., coffee/tea, sports drinks, fruit juices, alcohol), their independent effects (if any) may differ from those of NSBs. In other cases, the appropriate controls are not available. The effects of liquid meal replacement products on weight change are an example. Their effects have been reviewed previously (19, 76, 77). However, these studies generally replaced energy from solid foods with liquid meal replacement products while holding total energy intake constant; therefore, any effects of liquid meal replacements compared with solid foods on satiation and subsequent energy intake (possible mechanisms through which NSBs could affect weigh change) could not be assessed. Accordingly, these studies were excluded here.
There is also an interesting potential clinical implication. Future research may support the conjecture that reducing NSB consumption is not effective for most persons, but is effective for a subset of persons who are predisposed to or are already overweight. Should this come to pass, then as Durant, et al. (78) suggested, clinical recommendations and public policy measures might be better designed and meet less resistance from the general public to the extent that they can successfully meet the needs of the susceptible group without placing undue restrictions on the populace overall. The size of this subgroup warrants further consideration as it may range up to 67% of the population (the currently overweight and obese).
Suggestions for future research: types of research needed
This critical review of the literature suggests that the current evidence does not permit definitive conclusions about the effects of reducing long-term consumption of NSBs on BMI. This is due, largely, to the fact that few studies focused directly on the topic and thus were not appropriately designed to answer the question. Studies contrasting effects of consuming beverages with and without energy-yielding sweeteners do not provide insights on whether obtaining energy from beverages poses a particular risk. Contrasting responses to semi-solid and solid food forms is required to address this point. Neither do studies of sweeteners that do and do not provide energy determine whether sweeteners are especially problematic. Both are sweet, and sweetness may have independent effects on intake (79, 80). Comparisons of responses to beverages containing non-sweet energy sources, such as fat and protein, are essential to isolate the role played by sweeteners. Evidence from short-term feeding trials suggests that there is limited energy compensation for any of the macronutrients in beverages (5).
There is fairly strong experimental evidence that requiring subjects to consume additional energy in the form of NSBs increases weight (see Table 7). In contrast, while the totality of evidence relevant to the proposition that reducing NSB consumption will decrease weight, rate of weight gain, or the probability of being obese is suggestive, findings from RCTs are not supportive overall. However, these were effectiveness, not efficacy studies. As such, they may merely indicate that we are not yet terribly effective in getting people to reduce NSB consumption rather than showing that reducing NSB consumption per se does not reduce BMI. As noted elsewhere and in Table 7, rigorous long-term (i.e., ≥12 mo) efficacy (not effectiveness) studies of NSB reduction may be the next best step to determine whether reducing NSB consumption will reduce BMI or obesity levels. That being said, there is some evidence (Table 6) from the existing effectiveness trials that applied programs to discourage NSB consumption may have modest beneficial effects on BMI change among persons in the top one third of the BMI distribution. We calculate that, assuming a non-cluster randomized 2-arm parallel groups design, an RCT concluding with 300 to 500 subjects (and presumably randomizing more) might be required to test this hypothesis with adequate power.
Table 7.
Schematic representation of the types of RCTs that can and have been done regarding NSBs and obesity
| Independent Variables (Treatments) |
Study Types | |
|---|---|---|
| Efficacy Studies | Effectiveness Studies | |
| Mandatory consumption of NSBs, often versus mandatory consumption of non-NSBs (e.g., diet sodas). |
Four studies conducted (22,29,30,33). As meta- analyzed herein, those using higher doses tend to show increased weight gain with NSB consumption. |
None |
| Reducing NSB consumption among people who ordinarily consume NSBs. |
None done to date, though one [Ebbeling et al. 2006, (28)] may be perceived to come close. These are the studies that are needed to determine the truth of proposition b (see introduction) and the extent to which further large scale efficacy RCTs are warranted. |
Five studies conducted (6 reports). As meta-analyzed herein results on BMI have been consistently null when including the entire sample from each study. Three studies showed significant results in subsets of subjects (28,35) or dichotomous obesity indicators (26) that have not yet held up at extended follow-up. |
Although it is often preferable to establish the existence and probable consequence of a phenomenon before embarking on mechanistic studies to support it, the suggestive evidence reviewed here, coupled with published epidemiologic and short-term feeding trials, provides reasonable grounds to pursue mechanistic questions as a second level of investigation. For example, if NSBs promote positive energy balance as a result of their weak appetitive properties, what sites in the normal regulatory system are responsible? Options include, but are not limited to, cognition, orosensory signaling, gastrointestinal transit, differential activation of gut satiety mechanisms, rate of absorption, and post-absorptive endocrine responses. Mechanistic studies will provide support for noted effects in RCTs, contribute to understanding of ingestive behavior and physiology generally, and highlight intervention targets, should they be desirable.
The high incidence and prevalence of overweight and obesity and plausibility of NSB consumption as a contributor have prompted several feasibility trials where educational interventions aimed at curbing use were evaluated for effects on body weight (26, 28, 31). Such effectiveness studies might be considered a third-tier research need until the causal influence of NSB reduction per se and probable mechanisms can be established in efficacy trials. Knowledge of the latter will inform the design of the most efficient and effective clinical and public health management approaches.
Suggestions for future research: types of research not needed
It is apparent from this review that certain areas exist where further research may not be productive. In our view, continued conduct of observational studies correlating NSB consumption with aspects of adiposity has little merit. At this point, the question of the effects of NSBs on weight has been called; a hypothesis has been made. Only randomized experiments can provide the answers needed. Continued observational work in this area will offer more heat than light.
Conclusions
The effects of NSB consumption on body weight are difficult to discern. Considerable support for a direct association may be drawn from a diverse literature, but evidence from more definitive RCTs is lacking. Policymakers need act on the pressing problem of overweight and obesity, which regrettably means that decisions must now be made on imperfect knowledge. Understanding the risks associated with missteps, it is imperative future efforts be focused on the science most likely to fill current gaps in knowledge. In our opinion, this entails RCTs combined with targeted mechanistic studies, especially among those overweight or obese at baseline.
Acknowledgment
We thank Dr. Daniel Munoz for graciously supplying us with additional information about and analytic output from his study on several occasions. This activity was supported in part by NIH grants P30DK056336 and 5R01DK63185. The opinions expressed are those of the authors and not necessarily those of the NIH or any other organization with which the authors are affiliated.
Footnotes
Competing Interests: Dr. Allison has received grants, honoraria, donations, and consulting fees from numerous food, beverage, pharmaceutical companies, and other commercial and nonprofit entities with interests in obesity, including but not limited to Merck, Pfizer, Eli Lilly Co, Abbott Laboratories, SlimFast Foods, Frito-Lay, Kellogg Co, the Coca-Cola Company, PepsiCo, McDonald’s Corporation, the NY State Restaurant Association, the Dairy Council, General Mills, Kraft Foods, and PomWonderful. Dr. Mattes has received grants, honoraria, and consulting fees from numerous food, beverage, pharmaceutical companies, and other commercial and nonprofit entities with interests in obesity, including but not limited to the Eli Lilly Co, Abbott Laboratories, SlimFast Foods, Kellogg Co, Kraft Foods and the Dairy Council. Dr. Shikany has received grants and consulting fees from food companies with interests in obesity, including General Mills and Frito-Lay. Dr. Kaiser has no competing interests to report.
Ethical Approval: Not required.
References
- 1.Allison DB, Mattes RD. Nutritively sweetened beverage consumption and obesity: the need for solid evidence on a fluid issue. JAMA. 2009;301(3):318–20. doi: 10.1001/jama.2008.974. [DOI] [PMC free article] [PubMed] [Google Scholar]
- 2.Gillis LJ, Bar-Or O. Food away from home, sugar-sweetened drink consumption and juvenile obesity. J Am Coll Nutr. 2003;22(6):539–45. doi: 10.1080/07315724.2003.10719333. [DOI] [PubMed] [Google Scholar]
- 3.Belpoggi F, Soffritti M, Tibaldi E, Falcioni L, Bua L, Trabucco F. Results of long-term carcinogenicity bioassays on Coca-Cola administered to Sprague-Dawley rats. Ann N Y Acad Sci. 2006;1076:736–52. doi: 10.1196/annals.1371.078. [DOI] [PubMed] [Google Scholar]
- 4.Ogur R, Uysal B, Ogur T, et al. Evaluation of the effect of cola drinks on bone mineral density and associated factors. Basic Clin Pharmacol Toxicol. 2007;100(5):334–8. doi: 10.1111/j.1742-7843.2007.00053.x. [DOI] [PubMed] [Google Scholar]
- 5.Mourao DM, Bressan J, Campbell WW, Mattes RD. Effects of food form on appetite and energy intake in lean and obese young adults. Int J Obes (Lond) 2007;31(11):1688–95. doi: 10.1038/sj.ijo.0803667. [DOI] [PubMed] [Google Scholar]
- 6.Gibson S, Neate D. Sugar intake, soft drink consumption and body weight among British children: further analysis of National Diet and Nutrition Survey data with adjustment for under-reporting and physical activity. Int J Food Sci Nutr. 2007;58(6):445–60. doi: 10.1080/09637480701288363. [DOI] [PubMed] [Google Scholar]
- 7.Newby PK, Peterson KE, Berkey CS, Leppert J, Willett WC, Colditz GA. Beverage consumption is not associated with changes in weight and body mass index among low-income preschool children in North Dakota. J Am Diet Assoc. 2004;104(7):1086–94. doi: 10.1016/j.jada.2004.04.020. [DOI] [PubMed] [Google Scholar]
- 8.Johnson L, Mander AP, Jones LR, Emmett PM, Jebb SA. Is sugar-sweetened beverage consumption associated with increased fatness in children? Nutrition. 2007;23(7-8):557–63. doi: 10.1016/j.nut.2007.05.005. [DOI] [PubMed] [Google Scholar]
- 9.Sun SZ, Empie MW. Lack of findings for the association between obesity risk and usual sugar-sweetened beverage consumption in adults--a primary analysis of databases of CSFII-1989-1991, CSFII-1994-1998, NHANES III, and combined NHANES 1999-2002. Food Chem Toxicol. 2007;45(8):1523–36. doi: 10.1016/j.fct.2007.02.012. [DOI] [PubMed] [Google Scholar]
- 10.Bukowiecki LJ, Lupien J, Follea N, Jahjah L. Effects of sucrose, caffeine, and cola beverages on obesity, cold resistance, and adipose tissue cellularity. Am J Physiol. 1983;244(4):R500–R507. doi: 10.1152/ajpregu.1983.244.4.R500. [DOI] [PubMed] [Google Scholar]
- 11.Choi SB, Park CH, Park S. Effect of cola intake on insulin resistance in moderate fat-fed weaning male rats. J Nutr Biochem. 2002;13(12):727–33. doi: 10.1016/s0955-2863(02)00216-4. [DOI] [PubMed] [Google Scholar]
- 12.Garcia-Contreras F, Paniagua R, Avila-Diaz M, et al. Cola beverage consumption induces bone mineralization reduction in ovariectomized rats. Arch Med Res. 2000;31(4):360–5. doi: 10.1016/s0188-4409(00)00090-4. [DOI] [PubMed] [Google Scholar]
- 13.Newell GW, Elvehjem CA. Studies on the growth of rats raised on chocolate milk. Science. 1944;99(2577):411–2. doi: 10.1126/science.99.2577.411. [DOI] [PubMed] [Google Scholar]
- 14.Almiron-Roig E, Flores SY, Drewnowski A. No difference in satiety or in subsequent energy intakes between a beverage and a solid food. Physiol Behav. 2004;82(4):671–7. doi: 10.1016/j.physbeh.2004.06.003. [DOI] [PubMed] [Google Scholar]
- 15.Tsuchiya A, Almiron-Roig E, Lluch A, Guyonnet D, Drewnowski A. Higher satiety ratings following yogurt consumption relative to fruit drink or dairy fruit drink. J Am Diet Assoc. 2006;106(4):550–7. doi: 10.1016/j.jada.2006.01.004. [DOI] [PubMed] [Google Scholar]
- 16.Malik VS, Schulze MB, Hu FB. Intake of sugar-sweetened beverages and weight gain: a systematic review. Am J Clin Nutr. 2006;84(2):274–88. doi: 10.1093/ajcn/84.1.274. [DOI] [PMC free article] [PubMed] [Google Scholar]
- 17.Vartanian LR, Schwartz MB, Brownell KD. Effects of soft drink consumption on nutrition and health: a systematic review and meta-analysis. Am J Public Health. 2007;97(4):667–75. doi: 10.2105/AJPH.2005.083782. [DOI] [PMC free article] [PubMed] [Google Scholar]
- 18.Forshee RA, Anderson PA, Storey ML. Sugar-sweetened beverages and body mass index in children and adolescents: a meta-analysis. Am J Clin Nutr. 2008;87(6):1662–71. doi: 10.1093/ajcn/87.6.1662. [DOI] [PubMed] [Google Scholar]
- 19.Drewnowski A, Bellisle F. Liquid calories, sugar, and body weight. Am J Clin Nutr. 2007;85(3):651–61. doi: 10.1093/ajcn/85.3.651. [DOI] [PubMed] [Google Scholar]
- 20.Olsen NJ, Heitmann BL. Intake of calorically sweetened beverages and obesity. Obes Rev. 2009;10(1):68–75. doi: 10.1111/j.1467-789X.2008.00523.x. [DOI] [PubMed] [Google Scholar]
- 21.NIDDK [accessed 25 May 2006];Obesity Clinical Research. 2004 Internet: http://www.niddk.nih.gov/patient/patientobesity.htm.
- 22.Tordoff MG, Alleva AM. Effect of drinking soda sweetened with aspartame or high-fructose corn syrup on food intake and body weight. Am J Clin Nutr. 1990;51(6):963–9. doi: 10.1093/ajcn/51.6.963. [DOI] [PubMed] [Google Scholar]
- 23.DiMeglio DP, Mattes RD. Liquid versus solid carbohydrate: effects on food intake and body weight. Int J Obes Relat Metab Disord. 2000;24(6):794–800. doi: 10.1038/sj.ijo.0801229. [DOI] [PubMed] [Google Scholar]
- 24.Grandjean AC, Reimers KJ, Bannick KE, Haven MC. The effect of caffeinated, non-caffeinated, caloric and non-caloric beverages on hydration. J Am Coll Nutr. 2000;19(5):591–600. doi: 10.1080/07315724.2000.10718956. [DOI] [PubMed] [Google Scholar]
- 25.Raben A, Vasilaras TH, Moller AC, Astrup A. Sucrose compared with artificial sweeteners: different effects on ad libitum food intake and body weight after 10 wk of supplementation in overweight subjects. Am J Clin Nutr. 2002;76(4):721–9. doi: 10.1093/ajcn/76.4.721. [DOI] [PubMed] [Google Scholar]
- 26.James J, Thomas P, Cavan D, Kerr D. Preventing childhood obesity by reducing consumption of carbonated drinks: cluster randomised controlled trial. BMJ. 2004;328(7450):1237. doi: 10.1136/bmj.38077.458438.EE. [DOI] [PMC free article] [PubMed] [Google Scholar]
- 27.Van Wymelbeke V, Beridot-Therond ME, de LG V, Fantino M. Influence of repeated consumption of beverages containing sucrose or intense sweeteners on food intake. Eur J Clin Nutr. 2004;58(1):154–61. doi: 10.1038/sj.ejcn.1601762. [DOI] [PubMed] [Google Scholar]
- 28.Ebbeling CB, Feldman HA, Osganian SK, Chomitz VR, Ellenbogen SJ, Ludwig DS. Effects of decreasing sugar-sweetened beverage consumption on body weight in adolescents: a randomized, controlled pilot study. Pediatrics. 2006;117(3):673–80. doi: 10.1542/peds.2005-0983. [DOI] [PubMed] [Google Scholar]
- 29.Addington E. Doctoral Dissertation. Manhattan (KS): Kansas State University; 1988. Aspartame- or sugar-sweetened beverages: Effects on food appetites and mood in young adults. [Google Scholar]
- 30.Haub MD, Simons TR, Cook CM, Remig VM, Al-Tamimi EK, Holcomb CA. Calcium-fortified beverage supplementation on body composition in postmenopausal women. Nutr J. 2005;4:21. doi: 10.1186/1475-2891-4-21. [DOI] [PMC free article] [PubMed] [Google Scholar]
- 31.Munoz D. Doctoral Dissertation. Albany (NY): State University of New York; 2006. The efficacy of two brief interventions to reduce soda consumption in a college population. [Google Scholar]
- 32.James J, Thomas P, Kerr D. Preventing childhood obesity: two year follow-up results from the Christchurch obesity prevention programme in schools (CHOPPS) BMJ. 2007;335(7623):762. doi: 10.1136/bmj.39342.571806.55. [DOI] [PMC free article] [PubMed] [Google Scholar]
- 33.Reid M, Hammersley R, Hill AJ, Skidmore P. Long-term dietary compensation for added sugar: effects of supplementary sucrose drinks over a 4-week period. Br J Nutr. 2007;97(1):193–203. doi: 10.1017/S0007114507252705. [DOI] [PubMed] [Google Scholar]
- 34.Williams CL, Strobino BA, Brotanek J. Weight control among obese adolescents: a pilot study. Int J Food Sci Nutr. 2007;58(3):217–30. doi: 10.1080/09637480701198083. [DOI] [PubMed] [Google Scholar]
- 35.Sichieri R, Paula TA, de Souza RA, Veiga GV. School randomised trial on prevention of excessive weight gain by discouraging students from drinking sodas. Public Health Nutr. 2009;12(2):197–202. doi: 10.1017/S1368980008002644. [DOI] [PubMed] [Google Scholar]
- 36.Albala C, Ebbeling CB, Cifuentes M, Lera L, Bustos N, Ludwig DS. Effects of replacing the habitual consumption of sugar-sweetened beverages with milk in Chilean children. Am J Clin Nutr. 2008;88(3):605–11. doi: 10.1093/ajcn/88.3.605. [DOI] [PMC free article] [PubMed] [Google Scholar]
- 37.James J, Kerr D. Prevention of childhood obesity by reducing soft drinks. Int J Obes (Lond) 2005;29(Suppl 2):S54–S57. doi: 10.1038/sj.ijo.0803062. [DOI] [PubMed] [Google Scholar]
- 38.Murray R, Frankowski B, Taras H. Are soft drinks a scapegoat for childhood obesity? J Pediatr. 2005;146(5):586–90. doi: 10.1016/j.jpeds.2004.12.018. [DOI] [PubMed] [Google Scholar]
- 39.Marr L. Soft drinks, childhood overweight, and the role of nutrition educators: let’s base our solutions on reality and sound science. J Nutr Educ Behav. 2004;36(5):258–65. doi: 10.1016/s1499-4046(06)60389-8. [DOI] [PubMed] [Google Scholar]
- 40.Hawkes C. Regulating and litigating in the public interest: regulating food marketing to young people worldwide: trends and policy drivers. Am J Public Health. 2007;97(11):1962–73. doi: 10.2105/AJPH.2006.101162. [DOI] [PMC free article] [PubMed] [Google Scholar]
- 41.Newby PK. Are dietary intakes and eating behaviors related to childhood obesity? A comprehensive review of the evidence. J Law Med Ethics. 2007;35(1):35–60. doi: 10.1111/j.1748-720X.2007.00112.x. [DOI] [PubMed] [Google Scholar]
- 42.French S, Morris P. Assessing the evidence for sugar-sweetened beverages in the aetiology of obesity, a question of control. Int J Obes (Lond) 2006;30:S37–S39. [Google Scholar]
- 43.Flay BR. Efficacy and effectiveness trials (and other phases of research) in the development of health promotion programs. Prev Med. 1986;15(5):451–74. doi: 10.1016/0091-7435(86)90024-1. [DOI] [PubMed] [Google Scholar]
- 44.Review Manager (RevMan) [Computer program]. Version 5.0. The Nordic Cochrane Centre, The Cochrane Collaboration; Copenhagen: 2008. [Google Scholar]
- 45.The Cochrane Collaboration Higgins JPT, Green S, editors. Cochrane Handbook for Systematic Reviews of Interventions Version 5.0.2. 2008 updated September 2009. Available from www.cochrane-handbook.org.
- 46.Pereira MA. The possible role of sugar-sweetened beverages in obesity etiology: A review of the evidence. Int J Obes (Lond) 2006;30:S28–S36. [Google Scholar]
- 47.Saat M, Singh R, Sirisinghe RG, Nawawi M. Rehydration after exercise with fresh young coconut water, carbohydrate-electrolyte beverage and plain water. J Physiol Anthropol Appl Human Sci. 2002;21(2):93–104. doi: 10.2114/jpa.21.93. [DOI] [PubMed] [Google Scholar]
- 48.Mattes RD. Beverages and positive energy balance: The menace is in the medium. Int J Obes (Lond) 2006;30:S60–S65. [Google Scholar]
- 49.Booth DA. Mechanisms from models--actual effects from real life: the zero-calorie drink-break option. Appetite. 1988;11(Suppl 1):94–102. [PubMed] [Google Scholar]
- 50.Wilson MM, Purushothaman R, Morley JE. Effect of liquid dietary supplements on energy intake in the elderly. Am J Clin Nutr. 2002;75(5):944–7. doi: 10.1093/ajcn/75.5.944. [DOI] [PubMed] [Google Scholar]
- 51.Mensink RP, Katan MB. Effect of dietary fatty acids on serum lipids and lipoproteins. A meta-analysis of 27 trials. Arterioscler Thromb. 1992;12(8):911–9. doi: 10.1161/01.atv.12.8.911. [DOI] [PubMed] [Google Scholar]
- 52.Eisenhauer JG. Regression through the origin. Teaching Statistics. 2003;25(3):76–80. [Google Scholar]
- 53.Fry JC. Biological Data Analysis: A Practical Approach. Oxford University Press; New York: 1993. [Google Scholar]
- 54.Thompson SG, Higgins JP. How should meta-regression analyses be undertaken and interpreted? Stat Med. 2002;21(11):1559–73. doi: 10.1002/sim.1187. [DOI] [PubMed] [Google Scholar]
- 55.Mattes RD. Dietary approaches to exploit energy balance utilities for body weight management. In: Coulston CA, Boushey C, editors. Nutrition in the Prevention and Treatment of Disease. 2nd. Elsevier; San Diego, CA: 2010. in press. [Google Scholar]
- 56.Assmann SF, Pocock SJ, Enos LE, Kasten LE. Subgroup analysis and other (mis)uses of baseline data in clinical trials. Lancet. 2000;355(9209):1064–9. doi: 10.1016/S0140-6736(00)02039-0. [DOI] [PubMed] [Google Scholar]
- 57.Kernan WN, Viscoli CM, Makuch RW, Brass LM, Horwitz RI. Stratified randomization for clinical trials. J Clin Epidemiol. 1999;52(1):19–26. doi: 10.1016/s0895-4356(98)00138-3. [DOI] [PubMed] [Google Scholar]
- 58.Ebbeling CB, Ludwig DS. Nutritively sweetened beverages and obesity. JAMA. 2009;301(21):2209–10. doi: 10.1001/jama.2009.742. [DOI] [PubMed] [Google Scholar]
- 59.Hedges LV, Olkin I. Statistical Methods for Meta-analysis. Academic Press; Orlando, Florida: 1985. [Google Scholar]
- 60.Huedo-Medina TB, Sanchez-Meca J, Marin-Martinez F, Botella J. Assessing heterogeneity in meta-analysis: Q statistic or I2 index? Psychol Methods. 2006;11(2):193–206. doi: 10.1037/1082-989X.11.2.193. [DOI] [PubMed] [Google Scholar]
- 61.Dwan K, Altman DG, Arnaiz JA, et al. Systematic review of the empirical evidence of study publication bias and outcome reporting bias. PLoS One. 2008;3(8):e3081. doi: 10.1371/journal.pone.0003081. [DOI] [PMC free article] [PubMed] [Google Scholar]
- 62.Kavvoura FK, Liberopoulos G, Ioannidis JP. Selection in reported epidemiological risks: an empirical assessment. PLoS Med. 2007;4(3):e79. doi: 10.1371/journal.pmed.0040079. [DOI] [PMC free article] [PubMed] [Google Scholar]
- 63.Kyzas PA, Loizou KT, Ioannidis JP. Selective reporting biases in cancer prognostic factor studies. J Natl Cancer Inst. 2005;97(14):1043–55. doi: 10.1093/jnci/dji184. [DOI] [PubMed] [Google Scholar]
- 64.Gorman BS, Primavera LH, Allison DB. Papal: Software for generalized power analysis. Educ Psychol Meas. 1995;55:773–6. [Google Scholar]
- 65.Fryer JH. The effects of a late-night caloric supplement upon body weight and food intake in man. Am J Clin Nutr. 1958;6(4):354–64. doi: 10.1093/ajcn/6.4.354. [DOI] [PubMed] [Google Scholar]
- 66.Reid M, Hammersley R. The effects of blind substitution of aspartame-sweetened for sugar-sweetened soft drinks on appetite and mood. British Food Journal. 1998;100(5):254–9. [Google Scholar]
- 67.Mrdjenovic G, Levitsky DA. Nutritional and energetic consequences of sweetened drink consumption in 6- to 13-year-old children. J Pediatr. 2003;142(6):604–10. doi: 10.1067/mpd.2003.200. [DOI] [PubMed] [Google Scholar]
- 68.Cline AD, Tharion WJ, Tulley RT, Hotson N, Lieberman HR. Influence of a carbohydrate drink on nutritional status, body composition and mood during desert training. Aviat Space Environ Med. 2000;71(1):37–44. [PubMed] [Google Scholar]
- 69.Amagase H, Nance DM. A Randomized, Double-Blind, Placebo-Controlled, Clinical Study of the General Effects of a Standardized Lycium barbarum (Goji) Juice. The Journal of Alternative and Complementary Medicine. 2008;14(4):403–12. doi: 10.1089/acm.2008.0004. [DOI] [PubMed] [Google Scholar]
- 70.Lo E, Coles R, Humbert ML, Polowski J, Henry CJ, Whiting SJ. Beverage intake improvement by high school students in Saskatchewan, Canada. Nutr Res. 2008;28(3):144–50. doi: 10.1016/j.nutres.2008.01.005. [DOI] [PubMed] [Google Scholar]
- 71.Malik VS, Willett WC, Hu FB. Sugar-sweetened beverages and BMI in children and adolescents: reanalyses of a meta-analysis. Am J Clin Nutr. 2009;89(1):438–9. doi: 10.3945/ajcn.2008.26980. [DOI] [PubMed] [Google Scholar]
- 72.Mundt CA, Baxter-Jones AD, Whiting SJ, Bailey DA, Faulkner RA, Mirwald RL. Relationships of activity and sugar drink intake on fat mass development in youths. Med Sci Sports Exerc. 2006;38(7):1245–54. doi: 10.1249/01.mss.0000227309.18902.fe. [DOI] [PubMed] [Google Scholar]
- 73.Striegel-Moore RH, Thompson D, Affenito SG, et al. Correlates of beverage intake in adolescent girls: the National Heart, Lung, and Blood Institute Growth and Health Study. J Pediatr. 2006;148(2):183–7. doi: 10.1016/j.jpeds.2005.11.025. [DOI] [PubMed] [Google Scholar]
- 74.Brenner H, Loomis D. Varied forms of bias due to nondifferential error in measuring exposure. Epidemiology. 1994;5(5):510–7. [PubMed] [Google Scholar]
- 75.Mattes R. Fluid calories and energy balance: the good, the bad, and the uncertain. Physiol Behav. 2006;89(1):66–70. doi: 10.1016/j.physbeh.2006.01.023. [DOI] [PubMed] [Google Scholar]
- 76.Heymsfield SB, van Mierlo CA, van der Knaap HC, Heo M, Frier HI. Weight management using a meal replacement strategy: meta and pooling analysis from six studies. Int J Obes Relat Metab Disord. 2003;27(5):537–49. doi: 10.1038/sj.ijo.0802258. [DOI] [PubMed] [Google Scholar]
- 77.Keogh JB, Clifton PM. The role of meal replacements in obesity treatment. Obes Rev. 2005;6(3):229–34. doi: 10.1111/j.1467-789X.2005.00171.x. [DOI] [PubMed] [Google Scholar]
- 78.Durant N, Baskin ML, Thomas O, Allison DB. School-based obesity treatment and prevention programs: all in all, just another brick in the wall? Int J Obes (Lond) 2008;32(12):1747–51. doi: 10.1038/ijo.2008.165. [DOI] [PMC free article] [PubMed] [Google Scholar]
- 79.Blundell JE, Hill AJ. Paradoxical effects of an intense sweetener (aspartame) on appetite. Lancet. 1986;1(8489):1092–3. doi: 10.1016/s0140-6736(86)91352-8. [DOI] [PubMed] [Google Scholar]
- 80.Rogers PJ, Blundell JE. Separating the actions of sweetness and calories: effects of saccharin and carbohydrates on hunger and food intake in human subjects. Physiol Behav. 1989;45(6):1093–9. doi: 10.1016/0031-9384(89)90093-0. [DOI] [PubMed] [Google Scholar]