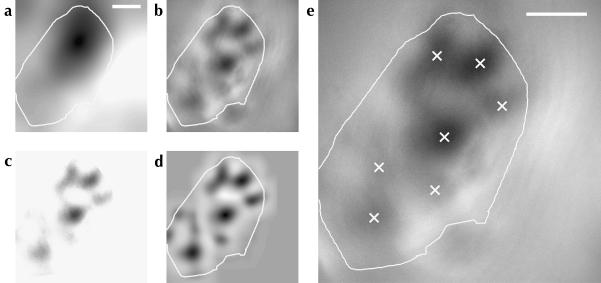
Figure 1.
Active region location process shown for a single OI response map. The local average (shown in a) of the response map was obtained by convolution with a disc kernel. This result was subtracted from the response map to remove large-scale variations in the image (b). The map was then thresholded to the mean of the area within the craniotomy mask (shown as a white outline on all subfigures); the result is shown in c. A Gaussian field was used as a model of an active region, and the correlation between this model and all points on the map was calculated (d). This results in a smooth image where peaks of higher intensity indicate the position of activity bumps in the original map. Peak locations were identified using nonmaximum suppression; these locations are shown in e as white crosses on the original OI response map. Scale bars: 1 mm.

