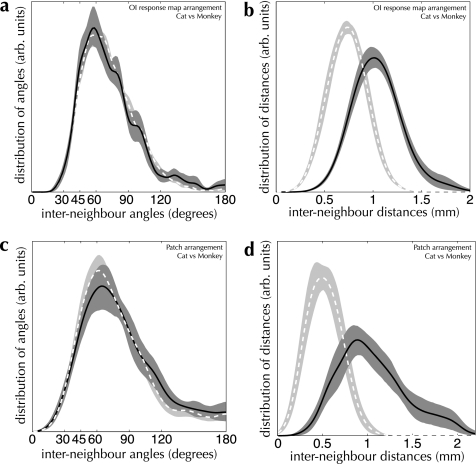
Figure 12.
Cross-species comparison of the spatial structure of OI response maps and patch spreads (a and b) Measured interneighbor angle (a) and distance (b) distributions from OI response maps in cat area 17 (dashed curve and light shading) and monkey V1 (solid curve and dark shading). Despite a large difference in spatial scale between cat and monkey (mode interneighbor distances of 1.01 mm and 0.74 mm, respectively), the spatial arrangement of active domains is indistinguishable (PK–S = 0.28; n = 266 maps in cat area 17, 16 maps in monkey V1). (c and d) Interneighbor angle (c) and distance (d) distributions from patch-labeling injections in cat area 17 (light dashed curves) and monkey V1 (dark solid curves). Once again, the difference in spatial scale is marked (0.90 mm vs. 0.50 mm for cat and monkey, respectively), while the spatial arrangement of patch locations is indistinguishable (PK–S = 0.20; n = 13 injections in cat area 17, 27 injections in monkey V1).

