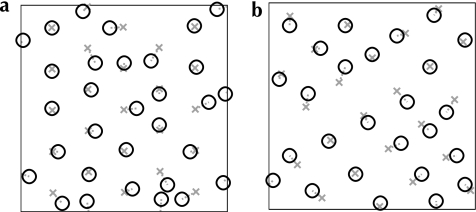
Figure 4.
Examples of jittered lattices, generated through a Neyman–Scott process (Neyman and Scott 1958). Base grids following a perfect hexagonal (a) or square (b) lattice are generated with random origins and rotations (gray crosses). For each vertex of a base grid, a secondary point is generated, at a uniform random offset from the base vertex (up to a factor δ of the nominal grid spacing) and with a uniform random offset direction (black circles). These secondary points are used as artificial patch or active region locations in our analysis. In this figure a jitter of δ = 0.5 is illustrated, which was the amount of jitter we found to most closely reproduce the measured experimental spatial distributions. The distributions of intervertex angles produced by these models are shown in Figure 5.

