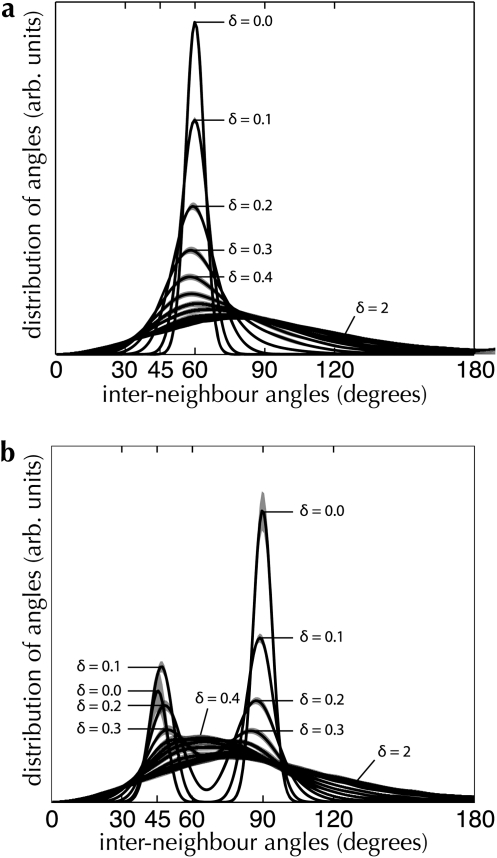
Figure 5.
Interneighbor angle distributions for 2 regular lattice models. Point sets were generated from lattice models with underlying hexagonal (a) and square (b) structures, as described in Materials and Methods. In both graphs, the degree of jitter (δ) is varied between 0 (a perfect lattice) and 2 (close to a Poisson distribution). Dark lines indicate the mean distribution; shading indicates the 95% CI, estimated over 100 random instances for the same jitter parameter.

