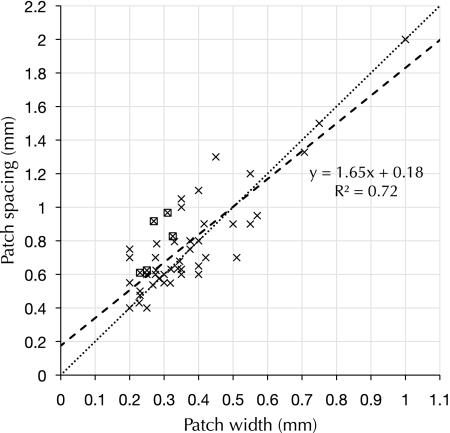
Figure 7.
Patch spacing versus patch width across many species and cortical areas. Observations of clustered labeling from Table 1 are shown here, when data for both patch width and patch spacing were reported. Each × is an individual observation of clustered labeling of intrinsic projections in a cortical area. A boxed × indicates that we have estimated the value of patch spacing from the published material. The dashed line is a linear regression of the data shown here, and explains 72% of the observed variance. The dotted line has a slope of 2 and is provided for comparison.

