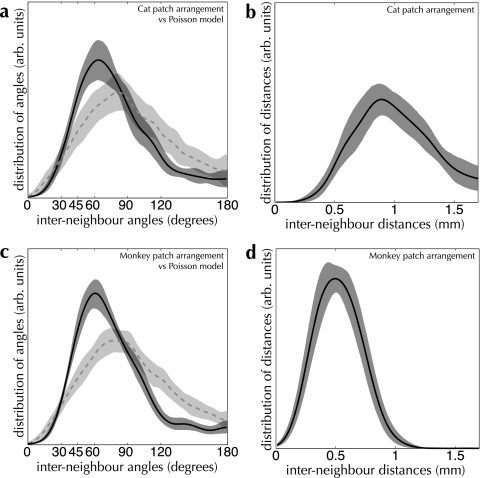
Figure 8.
Distributions of interneighboring-patch angle and distance for cat (a,b) and monkey (c,d), measured over our database of patch-labeling injections. Distances between neighboring patches (shown in the right-hand graphs) and angles between sets of neighboring patches (left-hand graphs) were collected from reconstructions of patch-labeling injections, as described in Materials and Methods. The mean distribution is shown as a solid curve in all graphs; distribution variance (shaded regions) was estimated by computing the 90% bootstrap CI. For comparison, the angle distribution measured from a Poisson random model is shown by the dashed line for both Cat and Monkey. (a and b) Measurements over patch-labeling injections in Cat primary visual cortex (area 17). The measured distribution of interneighbor angles differs significantly from a Poisson distribution of the same intensity (PK–S < 0.001). n = 13 injections. (c and d) Measurements over patch-labeling injections in Monkey area V1. The measured distribution of interneighbor angles differs significantly from a Poisson distribution of the same intensity (PK–S < 0.001). n = 27 injections. 1000 bootstrap resampling runs were performed to estimate CIs for the distributions in all graphs.

