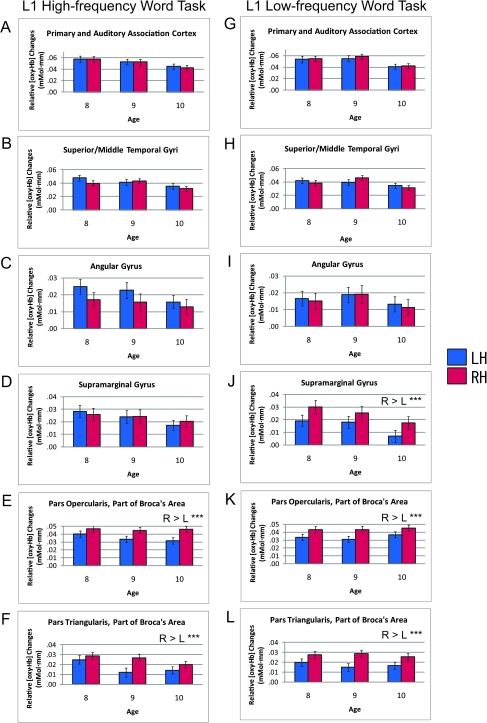
Figure 3.
Bar graphs of average brain activations of children during L1 word repetition tasks. ROI analyses were employed. The results of the L1 high-frequency word task are shown in (A–F) and those of the L1 low-frequency word task in (G–L): (A,G) primary and auditory association cortices (BA 41, 42), (B,H) superior/middle temporal gyri (BA 21, 22), (C,I) angular gyrus (BA 39), (D,J) supramarginal gyrus (BA 40), (E,K) pars opercularis, part of Broca’s area (BA 44), and (F,L) pars triangularis, part of Broca’s area (BA 45). Comparisons of 3 different age groups, 8–10, can be seen in each figure. The bar graphs show the relative changes in [oxy-Hb], and error bars indicate standard error. Asterisks indicate statistically significant results (*** corrected P < 0.001).

