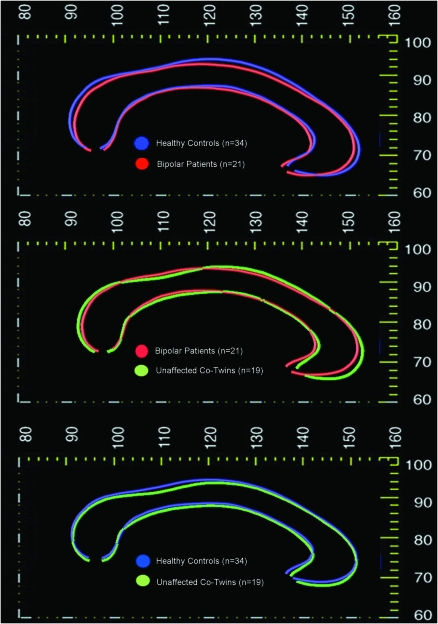
Figure 4.
Differences in callosal morphology. Callosal shape profiles mapped in groups defined by biological risk for bipolar disorder. Average anatomical mesh models of the CC are shown in different colors to illustrate differences between groups, indicating genetic and disease-related effects on callosal morphology. From the top, average callosal shape profiles are mapped in the following: 1) bipolar probands versus healthy control twins; 2) bipolar probands versus non-bipolar co-twins; and 3) unaffected co-twins of bipolar probands versus control twins.

