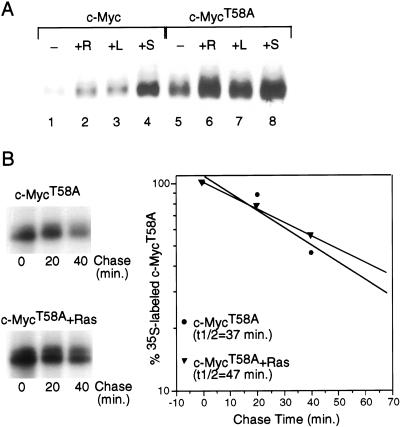
Figure 3.
Role of Threonine 58 in controlling Myc stability. (A) Quiescent REF52 fibroblasts were infected with either Ad-Myc or Ad-MycT58A (MOI = 25) together with either Ad-Ras61L (+R) or Ad-Con (all other samples; MOI = 200). Infected cells were maintained in low-serum medium (0.25%) for an additional 18 h and then harvested for Western blot analysis. Ad-Con-infected cells were either untreated (−), treated with 20% FCS for 4 h before harvesting (+S), or treated with 10 mM lactacystin for 4 h before harvesting ( +L). Western blot analysis used the C-33 monoclonal c-Myc antibody. (B) Quiescent REF52 cells were infected with Ad-MycT58A (MOI = 25), together with either Ad-Con (upper panel) or Ad-Ras61L (lower panel; MOI = 200). Infected cells were maintained in low-serum (0.25%) medium. Eighteen hours postinfection, cells were labeled in vivo with 35S-methionine for 30 min and chased in low-serum medium containing excess unlabeled methionine for the indicated times. Labeled c-MycT58A was immunoprecipitated from equal cell numbers for each time point and analyzed by SDS-PAGE. 35S-labeled c-MycT58A from each sample was quantitated by PhosphorImager. Background was calculated from an equivalent area in each lane and subtracted from the value for labeled Myc in that lane. Time 0 was set at 100. Data is plotted on a semi-log scale and best-fit lines were calculated using linear regression with the SigmaPlot program.

