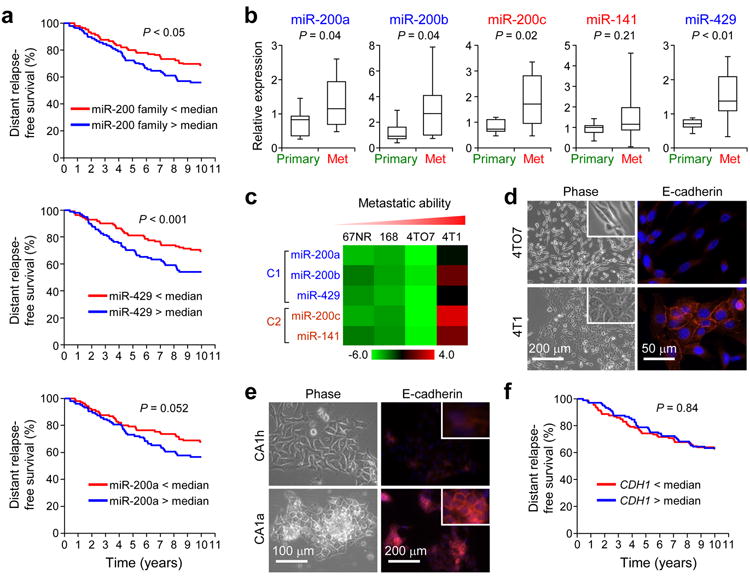
Figure 1.

MiR-200s are associated with poor prognosis in breast cancer. (a) Kaplan-Meier curves showing the distant relapse-free survival of 210 patients with high or low expression of the entire miR-200 family (top panel), miR-429 (middle panel) and miR-200a (bottom panel) in breast tumors. P values were computed by a likelihood ratio test. (b) Box plots showing miR-200 expression levels in ten human primary and metastasis samples as assessed by qRT-PCR analysis. Data is normalized to U6 and P values were computed by Student’s t-test. (c) Heat map showing miRNA expression levels in 4T1 series. 168: 168FARN. (d) Phase contrast images (left panel) and immunofluorescence (IF) images of 4TO7 and 4T1 cells stained for E-cadherin (right panel). (e) Phase contrast images (left panel) and IF images for E-cadherin (right panel) of MCFCA1h and MCFCA1a cells. Inserts highlight the membrane localization of E-cadherin. (f) Kaplan-Meier curves showing the distant-relapse free survival of 210 patients with high or low CDH1 expression. P values were computed by a likelihood ratio test.
