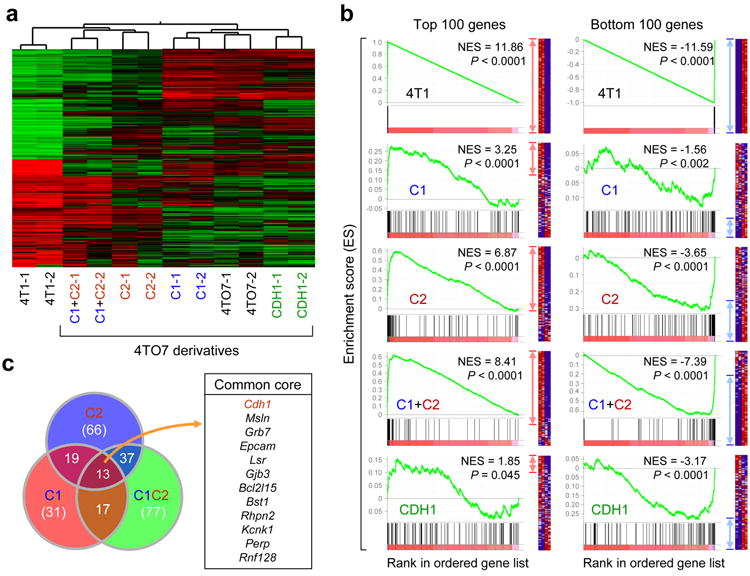
Figure 3.

Ectopic miR-200 expression promotes global changes in gene expression. (a) Unsupervised clustering highlighting genome-wide changes in gene expression upon miR-200 expression in 4TO7 cells. Experiment was performed twice in duplicates. (b) GSEA showing influence of miR-200 overexpression on the overall gene expression profile of 4TO7 cells. Gene sets used are the top 100 (left panel) and bottom 100 (right panel) differentially expressed genes in the test (C1, C2, C1+C2 and CDH1) vs control lines. Gene list used include all mouse genes ranked by their differential expression between 4T1 and 4TO7. Enrichment of top and bottom 100 genes from 4T1 vs. 4TO7 ranked list is shown as an example of maximum possible enrichment. ES: enrichment score. NES: normalized enrichment score. Red and blue arrows denote the relative number of core genes for each analysis. (c) Venn diagram showing significant overlap of core genes from top 100 gene sets for C1 (red circle), C2 (blue circle) and C1+C2 (green circle) lines from (b). Common core genes between C1, C2 and C1+C2 lines are presented. Cdh1 is highlighted in red font to emphasize the positive influence of miR-200s on E-cadherin expression.
