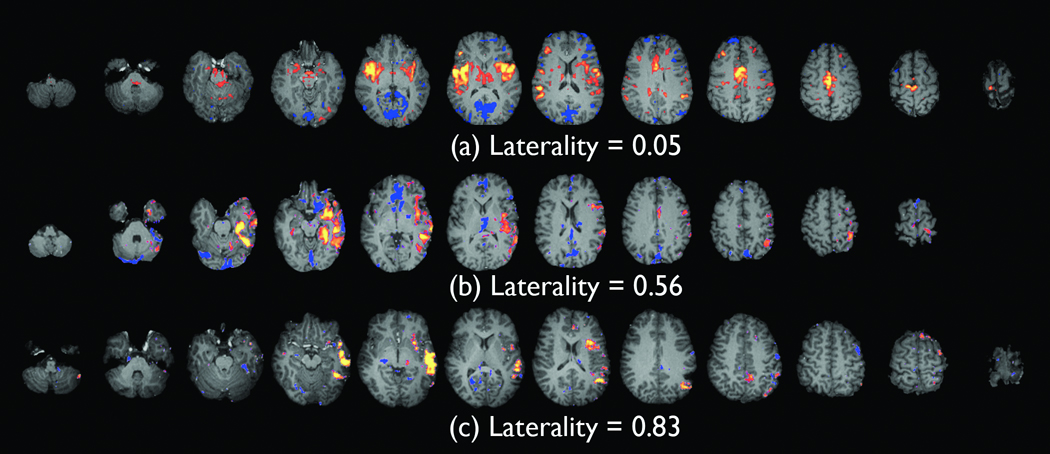
Figure 1.
Examples of spike correlated fMRI-seeded functional connectivity maps with low (a), medium (b), and high (c) laterality indices. The laterality values displayed are before laterality values of the controls are subtracted. The distinct lateralization of the functional connectivity can be clearly recognized in (b) and (c).

