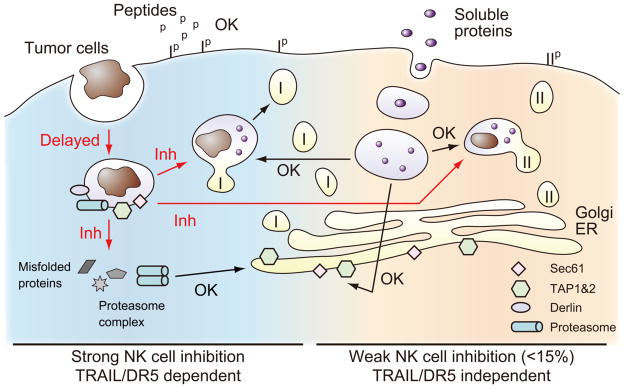
FIGURE 9. Summary of NK cell-mediated effects on Ag presentation by DCs.
NK cell effects on presentation of peptides, soluble proteins, and tumor cells has been evaluated. Key molecules involved in cross-presentation are indicated (Tap, Derlin, Sec61 and proteasome). The pathways inhibited by NK cells are indicated as red arrows “Inh”, and non-altered pathways as black arrows “OK”. MHC class I is indicated as “I”, and MHC class II as “II”. The exact location of proteins and vesicles are only approximate, and they are meant to show general pathways. See text for details.

