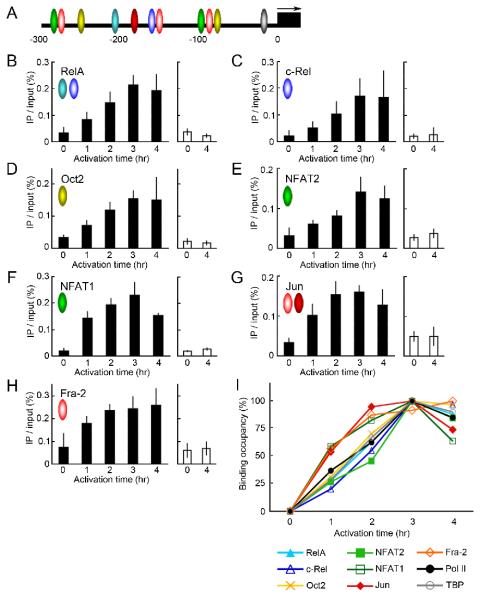
FIGURE 3.
The recruitment kinetics of transcription factors to the Il2 promoter region. A, Many transcription factors bind to the Il2 promoter in the 300 bp region upstream from the TSS. The binding sites of the ones examined are shown as colored ovals. The black box and arrow represent the 1st exon and transcription direction, respectively. B-H, The recruitment kinetics of transcription factors at the Il2 promoter in PR-T cells were analyzed with ChIP assays using Abs against RelA (B), c-Rel (C), Oct2 (D), NFAT2 (E), NFAT1 (F), Jun proteins (G), or Fra-2 (H). The activation led these transcription factors to be gradually recruited to the Il2 promoter (PCR position: −220 to −111) (closed columns). In each experiment the level of the Adad1 promoter in the precipitates was used as a control for non-specific binding in the ChIP assay (open columns). Colored ovals in each chart correspond to their binding sites in the Il2 promoter shown in A. I, The normalized recruitment kinetics for all the factors are summarized. Since the value of the Il2 promoter precipitated by all Abs in unactivated PR-T cells was close to that of the Adad1 promoter, this value was used as the “0%” background for the ChIP assay. The maximal level was generally observed in PR-T cells activated for 3 hrs (except for the Fra-2 ChIP, where it was 4 hrs). The percentage of the binding at these time points was designated “100%”.

