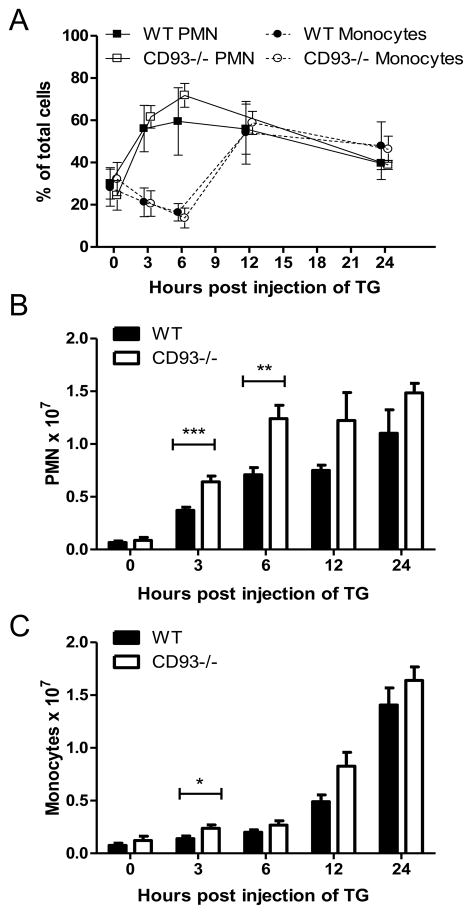
Figure 2. Analysis of monocyte/macrophage and neutrophil (PMN) populations in the peritoneal cavity of CD93−/− and wildtype mice.
Peritoneal cells were stained with Giemsa and differential cell counts were performed. 200 cells per mouse were scored blinded by three separate individuals and the percentage of PMNs and monocytes (A) and total PMN and monocyte numbers (B and C) were plotted. Bars represent the mean of at least three mice per genotype ± SD (* p < 0.05, **p < 0.01, ***p < 0.001).

