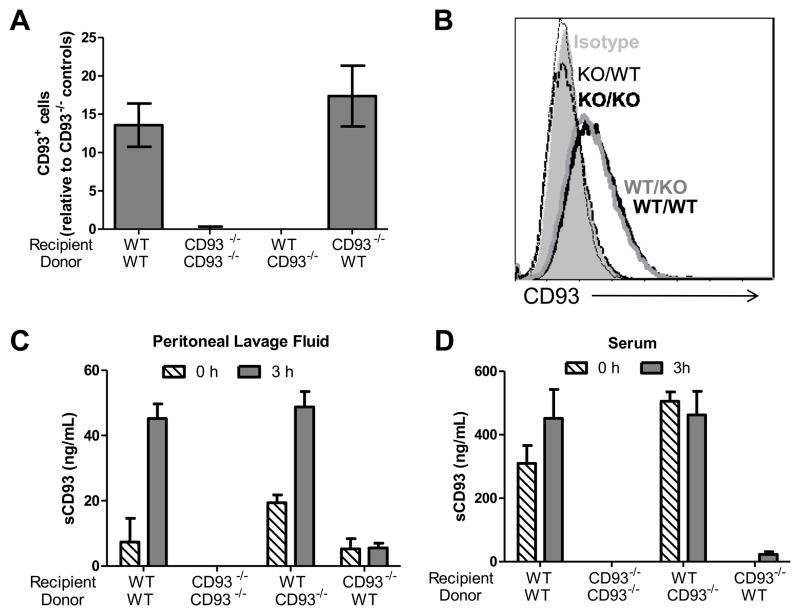
Figure 7. sCD93 is produced from non-hematopoietic cells in vivo.
Peripheral blood leukocytes were stained for CD93 and analyzed by flow cytometry. The bars represent the average percentage of CD93-positive cells relative to the CD93−/− controls from at least seven mice per group ± SEM (A). CD93 expression was also measured on BMDM by flow cytometry. Shown is an overlay of representative staining from an individual mouse in each group (isotype control filled gray; KO/KO [CD93−/− recipients with CD93−/− donors] dashed black line, KO/WT [wildtype recipients with CD93−/− donors] dashed gray line, WT/KO [CD93−/− recipients with wildtype donors] solid gray line; WT/WT [wildtype recipients with wildtype donors] solid black line, B). sCD93 was measured from peritoneal lavage fluid (C) and serum (D) from chimeric mice 0 (dashed bars) and 3 hours (gray bars) post injection of thioglycollate. Bars represent the mean of at least four mice per group (two mice for CD93−/− controls) ± SD.

