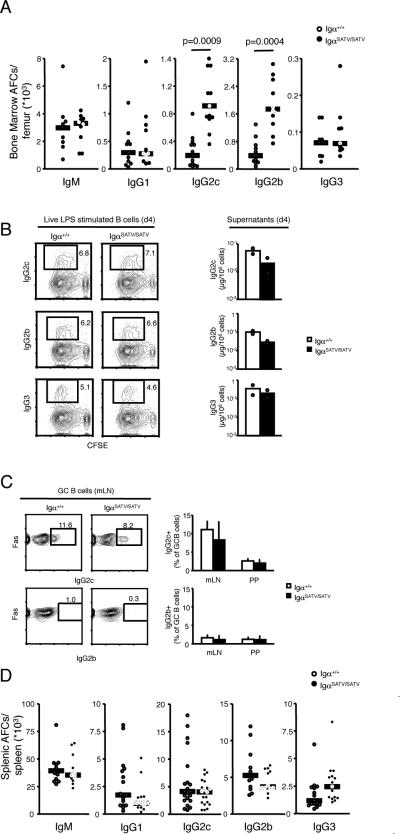
FIGURE 4. Plasma cell formation and Ig isotype switching.
A, Antibody forming cells in the bone marrow of one femur were quantified in 7-10 week old mice (n=9-13) in 5 independent experiments by ELISPOT analysis. Graphs show values from individual mice, medians and p-values as calculated by Student's T-test.
B, Ig class switching to IgG2c and IgG2b was determined by culture of splenic B cells from three 8 week old mice with 20μg/ml LPS for 4 days, staining with anti-IgG2c and IgG2b Ig and loss of CFSE by flow cytometry. Numbers shown represent the percentage of gated cells. IgG2c and IgG2b secretion by LPS stimulated B cells into the supernatants was determined by ELISA, and depicted as ratio of Ig to number of B cells plated on day 0. Results were comparable in a second independent experiment.
C, The fraction of IgG2c and IgG2b expressing GC cells in mesenteric lymph nodes and PPs were determined in 8-12 week old mice by flow cytometry (n=5-6) in two independent experiments. Histograms display averages and standard deviations.
D, Antibody forming cells in the spleen were quantified in 7-10 week old mice (n=8-18) by ELISPOT analysis. Graphs show values from individual mice, medians and p-values as calculated by Student's T-test.

