Fig. 4.

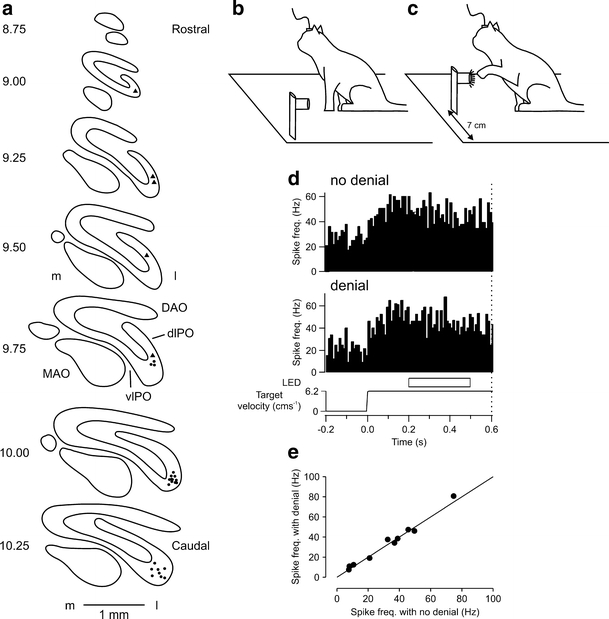
a Distribution of retrogradely labelled olive cells after a tracer injection of red latex microspheres was made into crus I coinciding with the parts of the cerebellar cortex where most of the microelectrode tracks were made. Equally spaced standard transverse outlines of the inferior olive between AP levels 10.25 and 8.75. Each circle and triangle corresponds to one retrogradely labelled cell in Cat P and Cat F, respectively. DAO, dorsal accessory olive; dLPO, dorsal lamella of the principal olive; l, lateral; m, medial; MAO, medial accessory olive; PF, primary fissure; vlPO, ventral lamella of the principal olive. b Schematic diagram of behavioural task. Cats were trained to perform a visually guided reaching task in the dark in which a tube, dimly lit by a ring of LEDs and containing a food reward was initially stationary 7 cm to the left of centre. c In a ‘go’ trial, the tube started to move horizontally in the rightwards direction at a constant velocity of 6.2 cm s−1. After an interval of approximately 600 ms after the commencement of target motion, the LEDs brightened to cue the animal to make a reach with its left forelimb, ipsilateral to the cerebellar recording, to retrieve a food reward from the tube. d Peri-event time histogram showing an example Purkinje cell which displayed a tonic increase in simple spike activity in relation to target motion. In one half of the trials, the moving target disappeared for 300 ms during target motion. Target denial occurred 200 ms after the onset of target motion. Dotted vertical line at 0.6 s represents ‘go’ signal. e Comparison of responses during target denial with no denial control. No significant change (paired t test, p > 0.05, n = 10). Line represents unity. Adapted from [118]
