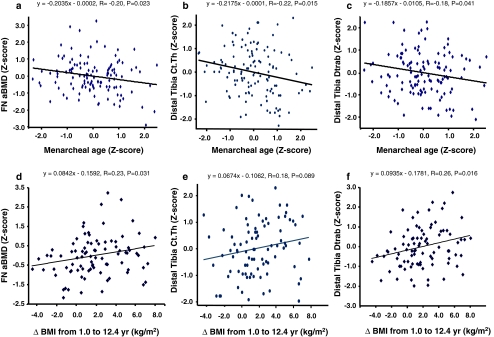
Fig. 1.
Femoral neck aBMD, cortical thickness, and trabecular bone density of distal tibia measured at peak bone mass: relation with menarcheal age and change in BMI during childhood. The six linear regressions were calculated with the data prospectively recorded in 124 healthy girls. The regression equations are indicated above each plot, with the corresponding correlation coefficient and the statistical P values. The slopes of the three bone variables (Y) are negatively and positively related to menarcheal age (upper plots: a, b, c) and change in BMI from 1.0 to 12.4 years (lower plots: d, e, f), respectively. See text for further details

