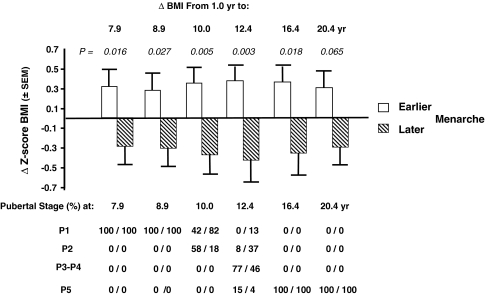
Fig. 2.
Changes in BMI from 1.0 to 20.4 years in healthy subjects segregated by the median of menarcheal age. The diagram illustrates that the change in BMI Z-score from 1.0 year of age on between subjects with menarcheal age below (EARLIER) and above (LATER) the median is statistically significant at 7.9 and 8.9 years, an age at which all girls were still prepubertal (Tanner stage P1) as indicated below the diagram. The difference culminates at 12.4 years, and then declines afterwards. Note that the progression of BMI from birth to 1.0 year of age was very similar in the EARLIER (from 13.0 to 16.7 kg/m2) and LATER (from 13.1 to 17.0 kg/m2) subgroups (see Table 3). The number of subjects for each age is presented in Table 3. See text for further details. P values between EARLIER and LATER group at each age are indicated above the diagram

