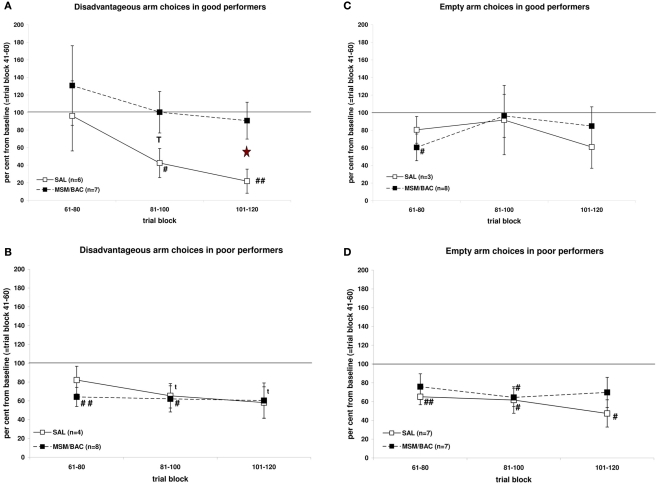
Figure 3.
Effects of injections of MSM/BAC or saline into the mPFC on r-IGT performance for the disadvantageous choices (A,B) and empty arm choices (C,D). Shown are means ± SEMs of per cent change from base-line (=trial block 41–60). T: p ≤ 0.10 MSM/BAC versus saline; *: p ≤ 0.05 MSM/BAC versus saline; t: p ≤ 0.10 relative to 100%; #: p ≤ 0.05 relative to 100%; ##: p ≤ 0.01 relative to 100%.

