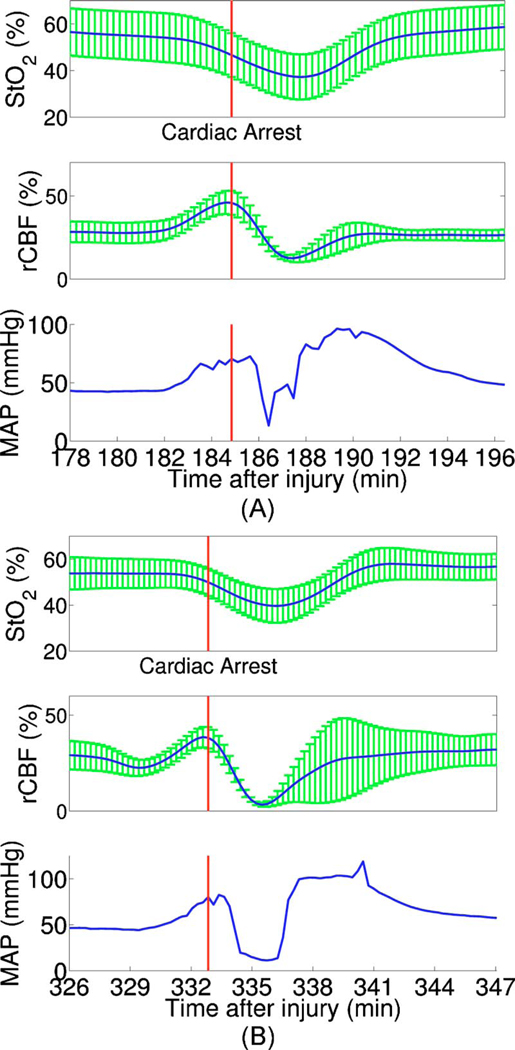
Fig. 6.
Cerebral hemodynamic changes in a single animal during two episodes of apnea followed by cardiac arrest. (A) The onset of apnea produced the same StO2, rCBF, and MAP trends observed in Fig. 5. Cardiac arrest (solid vertical line) caused a significant decrease in MAP and rCBF, resulting in a further significant decrease in StO2. After ventilatory resuscitation, StO2, rCBF, and MAP gradually returned to preapnea levels. (B) The same “biphasic” dynamic change was observed during apnea in the same animal 2 h later. Error bars in StO2 and rCBF represent standard deviation from large source-detector separations (1, 1.5, and 2 cm).

