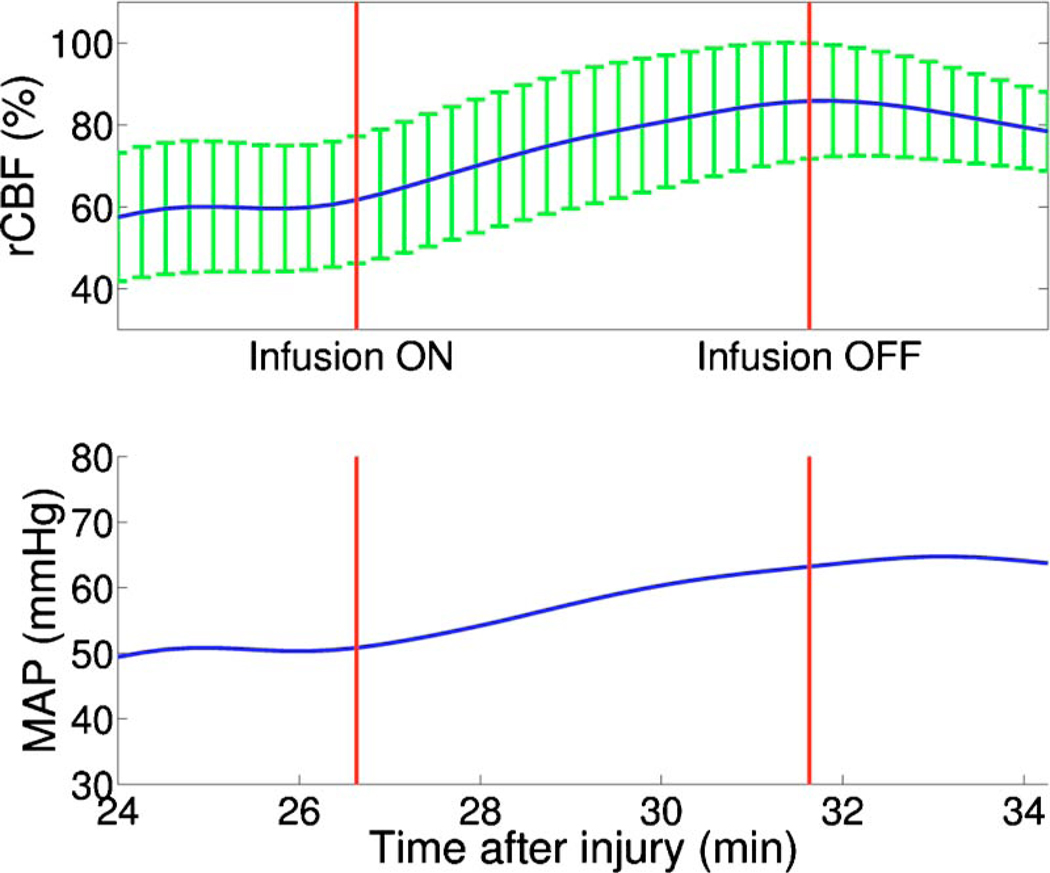
Fig. 7.
Cerebral hemodynamic changes during hypertonic (3%) saline infusion. The infusion effectively elevated rCBF and MAP. The solid vertical lines indicate the start and end of the infusion. Error bars in rCBF represent standard deviation from large source-detector separations (1, 1.5, and 2 cm).

