
Figure 2.
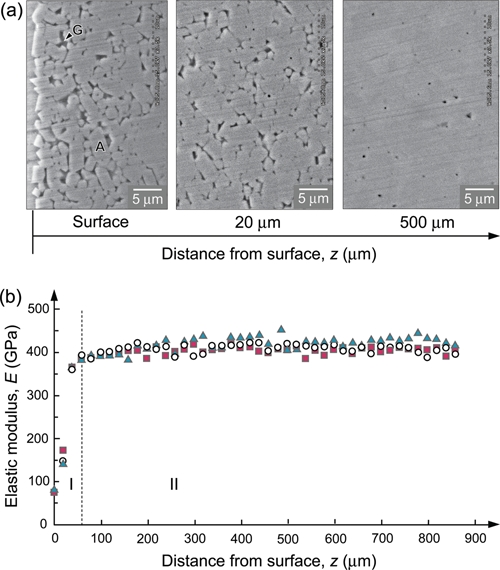
Microstructural and mechanical properties of graded glass/alumina/glass (GAG) structures. (a) SEM image of the surface of a graded alumina-glass layer (left), 20 µm into the graded zone (center), and an alumina core (right). Note: G and A represent glass and alumina phases, respectively. (b) The Young’s modulus profile across section of infiltrated GAG, plotted as function of distance z from outer surface. Note gradation of values within graded zone (I), and constant value within bulk (II). Different symbols represent separate tests on 3 GAG specimens.