Figure 3.
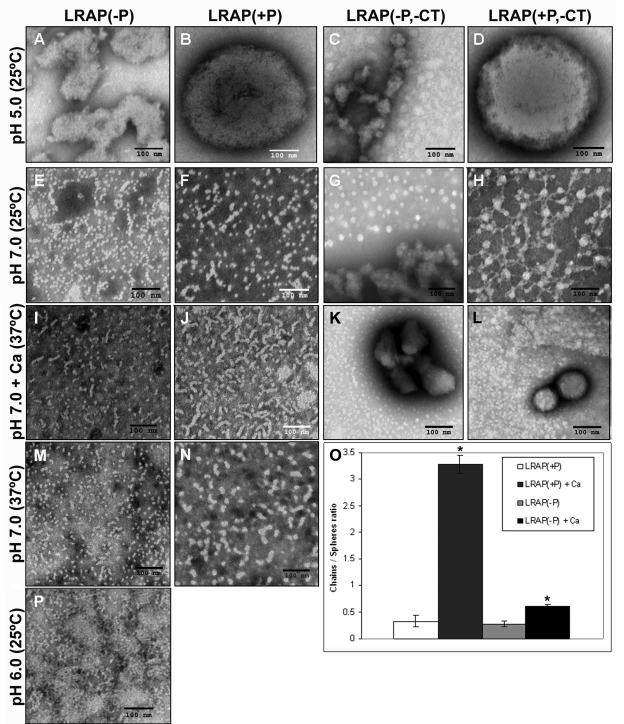
TEM images with PTA staining of LRAP(-P) (A, E, I, M, P), LRAP(+P) (B, F, J, N), LRAP(-P,-CT) (C, G, K), and LRAP(+P,-CT) (D, H, L) in 20 mM MES buffer at pH 5.0 (A-D), 20 mM MOPS buffer at pH 7.0 (E-H), and 20 mM MES buffer at pH 6.0 (P) at 25°C, and at pH 7.0 at 37°C without (M, N) and with (I-L) 2.5 mM CaCl2. All protein concentrations were 2 mg/mL. Note that nanospheres and chain-like particles were observed at neutral pH with LRAP(-P) (E, M) and LRAP(+P) (F, N), but not with LRAP(-P,-CT) and LRAP(+P,-CT) (G, H). Chain-like particles were predominant with LRAP(+P) in the presence of calcium (J), indicating an assembly of the nanospheres into chains. (O) Comparison of the effect of added calcium on the ratio of chain-like structures to spheres of LRAP(+P) and LRAP(-P) at pH 7.0 and 37°C, under the same conditions used for I, J, M, and N. As shown and discussed in the text, the ratio of chain-like structures to spheres increased significantly (p < 0.02) for both LRAP(+P) and LRAP(-P) in the presence of calcium, and, to a greater extent, for LRAP(+P). We obtained results by counting [using cell count (Image J)] the numbers of isolated spheres and chains (n= 200 to 1200) on 5 representative TEM images from a minimum of 3 experiments. Scale bar in all images is 100 nm.

