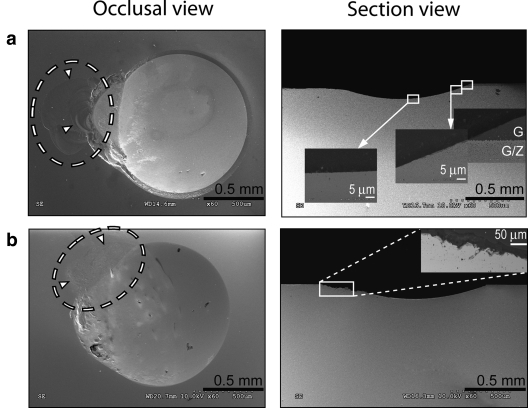
Figure 3.
SEM images of the occlusal surface view (left) and cross-sectional view (right) for (a) e-GZG and (b) monolithic Y-TZP after 2 x 10⁶ cycles of sliding contact loading. Material spalling is indicated by white dashed circles in the left-hand images. Insets on the right represent the higher magnification of the specific sites.

