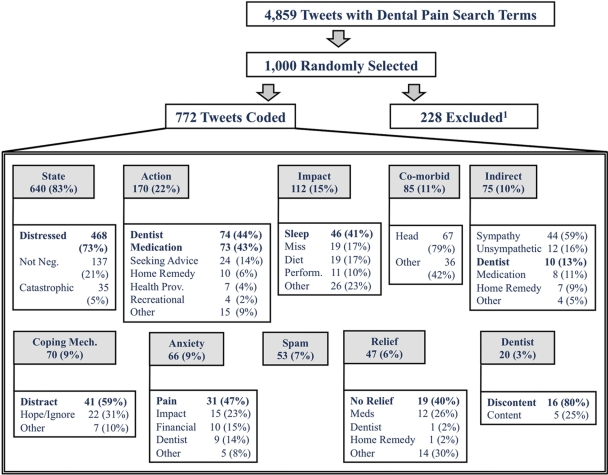
Figure 1.
Frequencies of primary categories (PC) and secondary categories (SC), n (%). Gray-shaded boxes contain PCs, while non-shaded boxes contain SCs. The PCs are ordered from most frequent to least frequent. The categories are not mutually exclusive, and therefore the percentages of PCs may not total 100% and the percentages of SCs may not total 100%. The denominator used for PC was the sample size following the removal of tweets that met exclusion criteria (PC denominator n = 772). The denominator used for SC was the number of tweets coded in the respective PC (e.g., SC denominator for all SC under Statement = 640, for SC under Action = 170, for SC under Impact = 112, etc.). Re-tweets, unrelated or ambiguous tweets, tweets from repeat users, and any uninterpretable tweets were excluded from the sample (n = 228).

