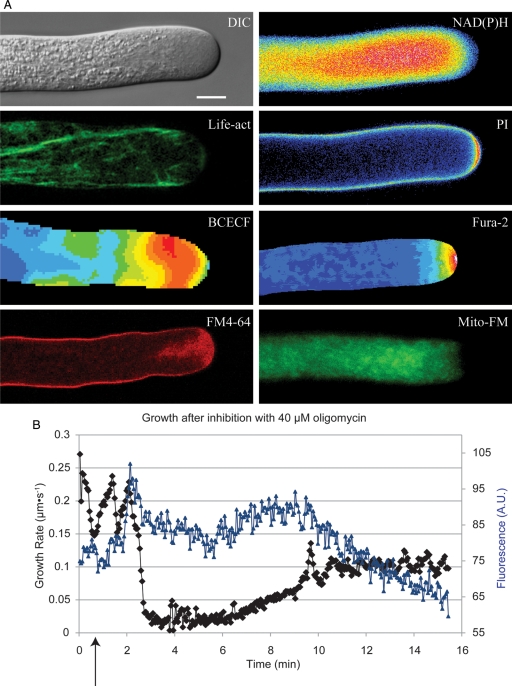
Fig. 1.
Lily pollen tubes and growth rate oscillations. (A) Lily pollen tubes imaged using different techniques. DIC is a differential image contrast micrograph of a growing lily pollen tube. NAD(P)H shows fluorescence from endogenous NAD(P)H (Cárdenas et al. 2006). Life-act shows labelling with Life-act-GFP, which labels actin (Vidali et al. 2009). PI shows propidium iodide fluorescence labelling the cell wall (McKenna et al. 2009). BCECF represents a pollen tube injected with dextranated BCECF, a ratiometric dye for pH (Feijó et al. 1999). Fura-2 is a cell injected with Fura-2 dextran, a Ca2+-sensitive ratiometric dye (Pierson et al. 1996). FM4-64 stains membranes, primarily involved with exocytosis (Parton et al. 2001). Mito-FM shows Mitrotracker-FM staining of mitochondria (Lovy-Wheeler et al. 2007). The scale bar represents 10 µm. (B) Growth rate oscillations (black) continue during growth in oligomycin. The arrow denotes addition of oligomycin. The blue trace represents NAD(P)H signal. NAD(P)H does not oscillate during growth in oligomycin. The figure was originally printed in Rounds et al. (2010).

