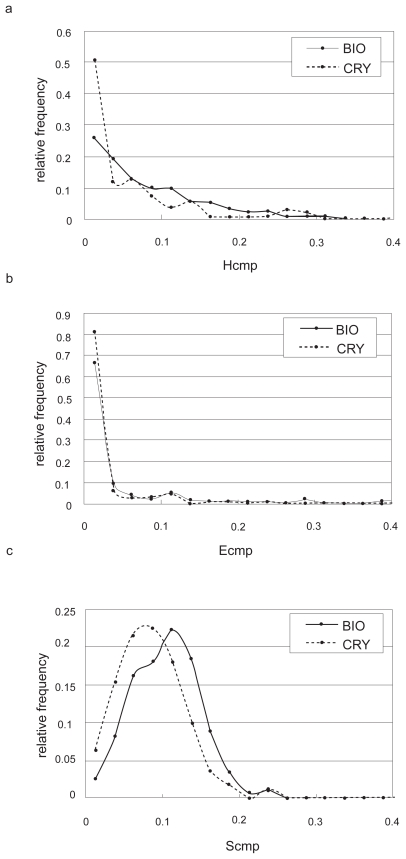
Figure 3.
The relative frequencies of the complementarities for a) hydrophobicity, b) electrostatic potential and c) shape. The thick lines in the three figures indicate the distributions of complementarities in the biological contact set (BIO), and the dotted lines indicate those in the crystal-packing contact set (CRY).

