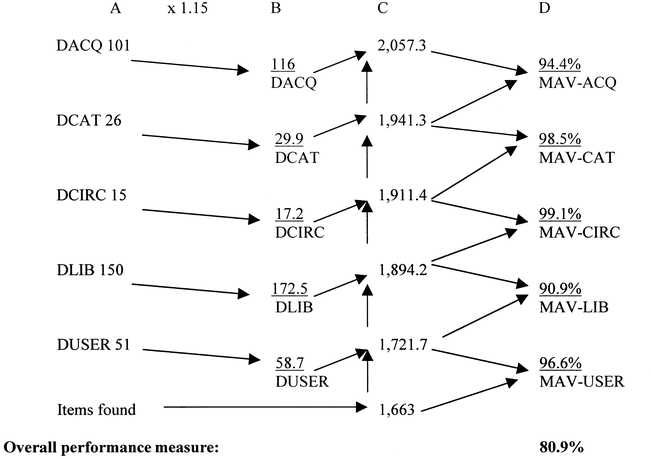
Figure 2.

Availibility analysis formCorrection factor = reported failures/analyzed failures = 393/343 = 1.15· Column A shows the number of failure occurrences in each category.· Column B shows the results of multiplying Column A by the correction factor, so distributing DBIB failure occurrences proportionately across the other data, as described above.· The numbers in Column C are obtained by progressively adding the adjusted figures in Column B to the total number of successful searches (1,663).· The final percentages obtained in Column D are found by dividing the lower number by the upper number in each consecutive pair of numbers in Column C.
