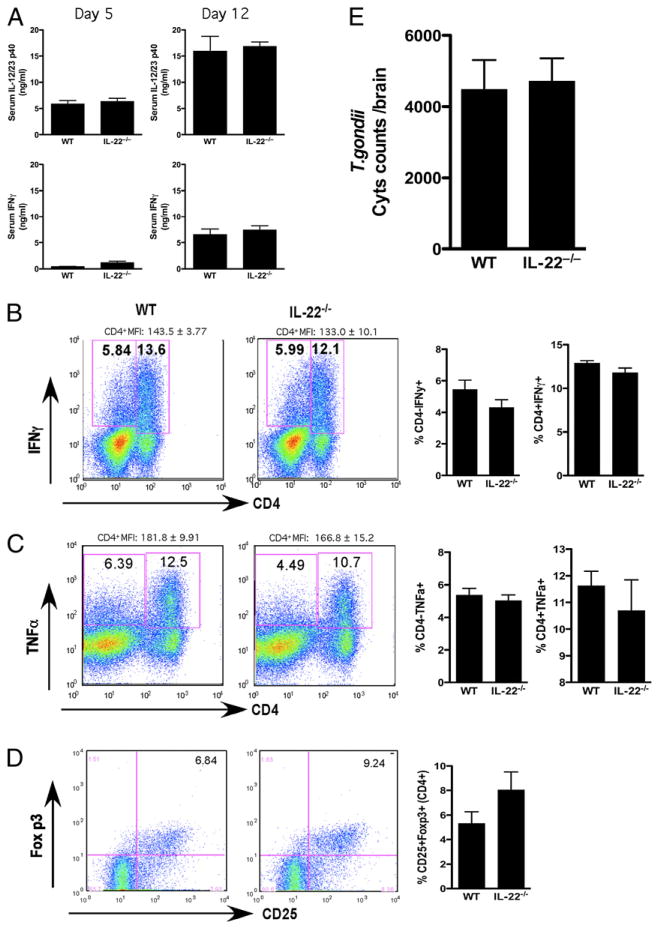
FIGURE 5.
IL-22 deletion does not impact T. gondii-induced Th1 responses in vivo. Mice were infected i.p. with 20 cysts of T. gondii (ME49 strain). One of three experiments with five mice per group is shown. Data are presented as mean ± SEM. A, Serum IL-12/23p40 and IFN-γ at day 5 and day 12. B, Frequency of IFN-γ+ lymphocytes in spleen. Representative FACS plots are shown on the left, with mean ± SEM of five mice per group shown on the right. C, Frequency of TNF-α+ lymphocytes in spleen. Representative FACS plots are shown on the left, with mean ± SEM of five mice per group shown on the right. D, Frequency of CD25+Foxp3+ in CD4+ cells in spleen. Representative FACS plots are shown on the left, with mean ± SEM of five mice per group shown on the right. E, T. gondii cyst burden in the brain of mice infected for 30 d.

